Kansas City Sees Rising Property Values In 2023
Kansas City, MO’s real estate market saw robust growth from January 2023 to 2024, with rising average property values and noticeable market activity.

Key Takeaways
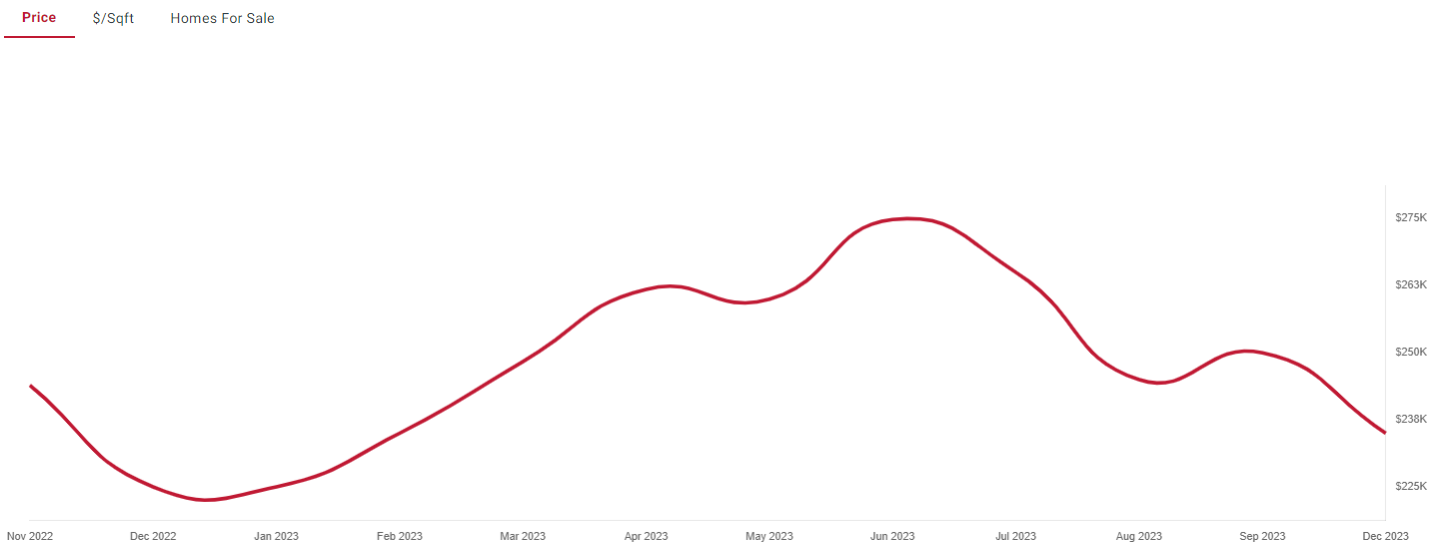
- Kansas City, MO average property values rose from $225,000 in January 2023 to $239,150 in January 2024.
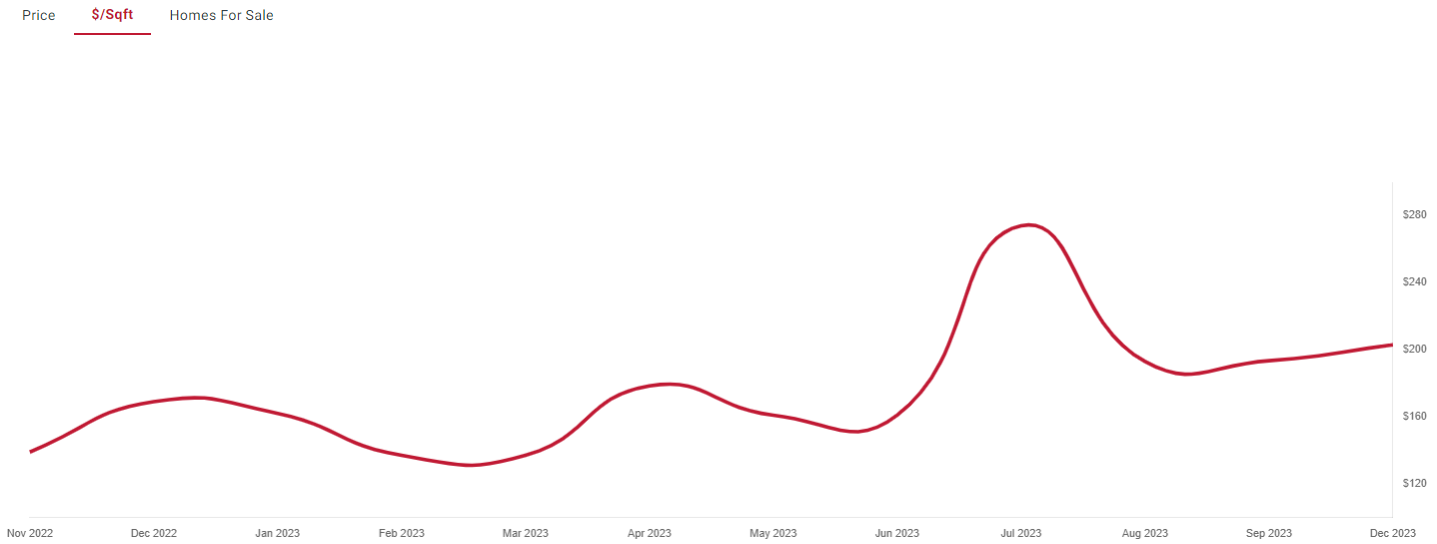
- Sold price per square foot rose from $173.60 to $177.00 over the same period.
- Platte County consistently had higher values and prices per square foot than Clay and Jackson counties.
- Nearby Weston stood out with a $1,100,000 value in January 2024.
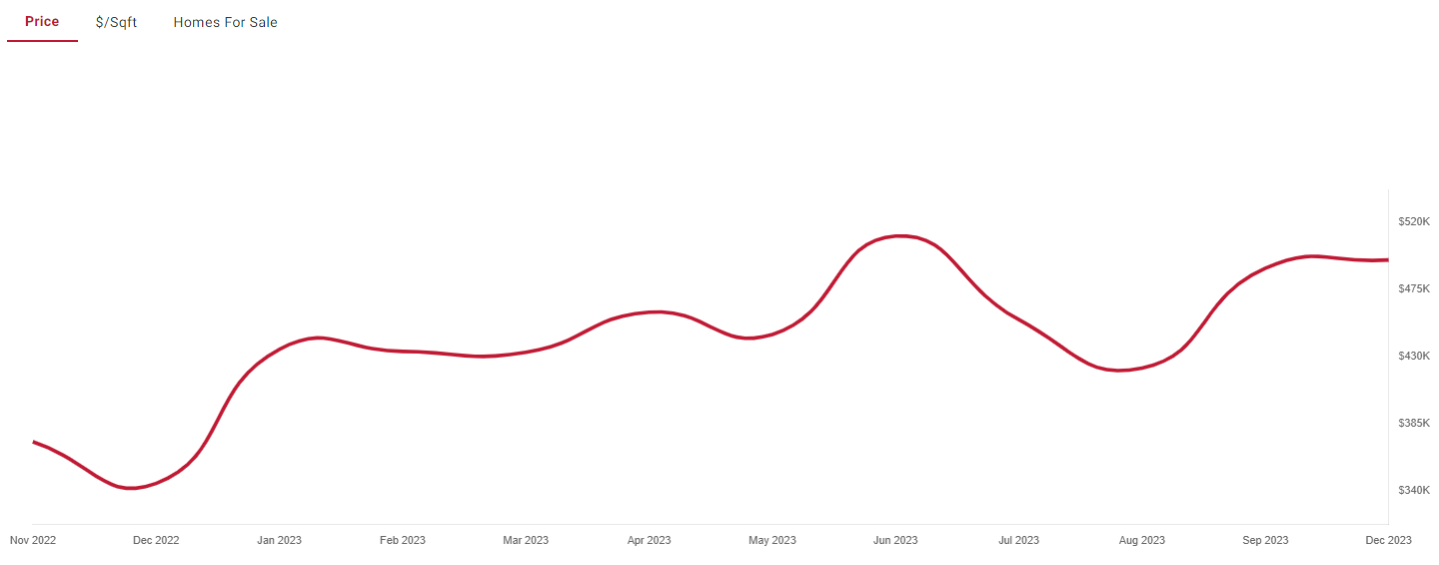
Kansas City, Missouri saw a continuation of a positive real estate trend with rising property values and a considerable number of home sales in 2023. Broadly, this trend is underscored by the fact that average property values in this vibrant metropolis have increased from $225,000 in January 2023 to $239,150 a year later.
However, this growth has not been uniform across all regions within Kansas City. While the city as a whole has seen a robust growth, different counties and zip codes show varying levels of activity and average property values. This hints at the potential variations in property types and housing demand across different neighborhoods.
Some key points highlighted by the latest 12 months include:
- Increases in property values over time
- Less real estate activity in nearby cities like Winston and Wellington
- Differences in real estate trends across different counties
- High property values in the city of Weston, when compared with other nearby cities
- Stable real estate market with low distress sales
Variation in Price per Square Foot
The rising trajectory of property values is also manifest in the price per square foot data. On average, the sold price per square foot in Kansas City, MO, went up from $173.60 in January 2023 to $177.00 in January 2024. However, the overall trend has not been linear. Interspersed in this growth timeline were months when the price per square foot increased substantially. This variability might be owed to the nature of the properties sold or prevailing market conditions during these specific months.
As opposed to the dynamic real estate market in Kansas City, MO, nearby cities – notably Winston and Wellington – have displayed significantly less activity over the period under review. In these smaller markets, the property turnover is meager, as indicated by many instances of just 1 property count and no sold properties in specific months.
When we zero in on other counties within Kansas City, such as Platte, Clay, and Jackson, we unearth more disparities. The average values and sold prices vary across the counties, with properties in Platte County registering consistently higher values and sold prices per square foot than their counterparts in Clay and Jackson counties.
Weston’s High Property Values
Among nearby cities, Weston is the standout performer based on average property values. As of January 2024, the median value in Weston stood at a staggering $1,100,000, while the per square foot value was $219, significantly outstripping property value averages in Kansas City, MO.
The market report is packed with useful data, leaving no doubt that Kansas City, MO, harbors a vibrant and growing real estate market. Whether you are considering buying a property or investing in real estate, you’ll find the intricate details of Kansas City, MO’s real estate landscape enlightening and instrumental as you map out your next move.
Frequently Asked Questions
Are home values rising in Kansas City, MO?
Yes. Average property values rose from $225,000 in January 2023 to $239,150 in January 2024.
Which Kansas City county has the highest home values?
Platte County consistently registered higher values and sold prices per square foot than Clay and Jackson counties.

About the author: Manuel Martinez
RealtyTrac contributor
Manuel Martinez is a contributor to RealtyTrac who writes about local housing markets, home buying and real estate investing. He has written for RealtyTrac since 2013, covering city and state market reports, home buying guides and tips, investment financing and strategies for buying and flipping homes.
More in Market Reports
Member Features
Find Real Estate Bargain!
Full foreclosure details
Home value, equity and ownership info
Find homes priced below market
Get full access with a FREE Account
Already a member?
Useful Calculators
- Home Affordability CalculatorThe price range your income and debts support under the 28/36 rule.
- Rent vs. Buy CalculatorThe total cost of owning versus renting over your time in the home.
- Rental Property ROI CalculatorCash flow, NOI, cap rate and cash-on-cash return for a rental.