Henderson Real Estate Market Report March 2024
Henderson’s real estate market, from March 2023 to February 2024, demonstrates adjusting property values, consistent demand, and the significance of when to list or sell properties.


Key Takeaways
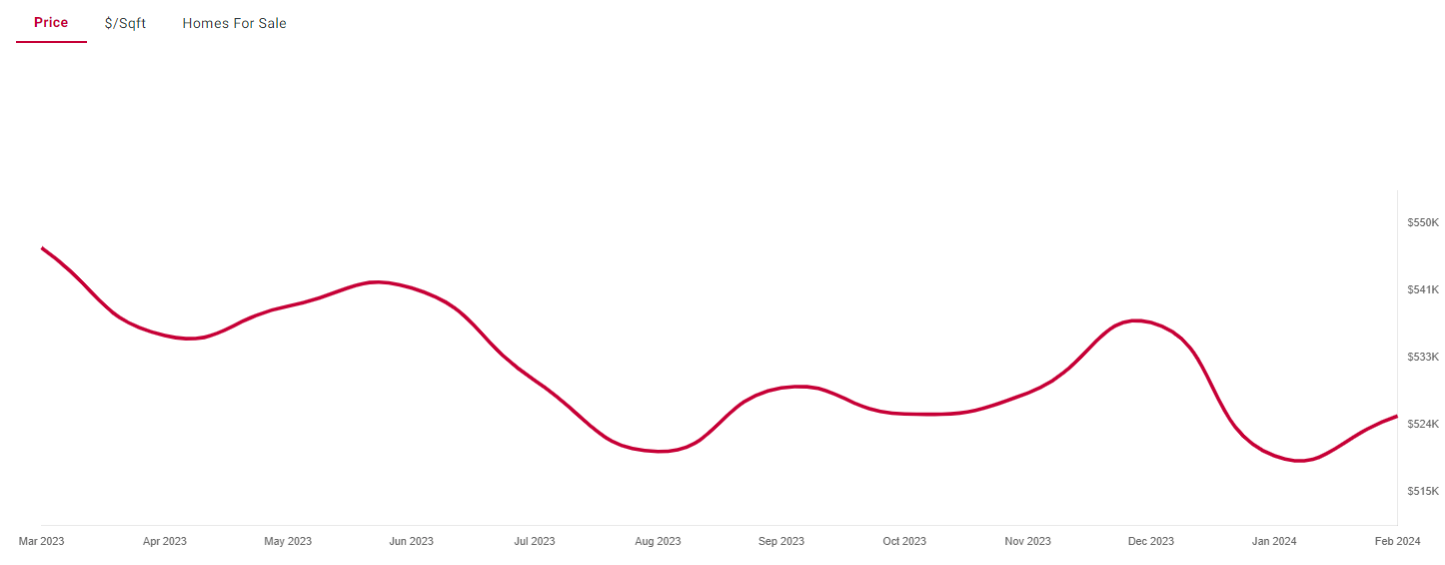
- Henderson, NV values fell about 4%, from $547,000 in March 2023 to $525,000 in February 2024.
- Average sold price slipped about 1%, from $481,000 to nearly $477,000.
- Listing price per square foot rose from $264 to $272.
- Sales peaked at 5,312 in November before easing to 4,717 in February.
Home prices in Henderson, Nevada saw a small decline in the last 12 months. Starting at approximately $547,000 in March 2023, property values experienced a downward tilt, settling around $525,000 by February 2024. This 4% decrease might be reflective of a cooling period in the housing market or a market normalization following an unprecedentedly bullish period.
Concurrently, a contrasting trend emerges in the price per square foot of properties, increasing from $264 to $272 by the end of the observed period. This uptick, albeit modest, is indicative of a sustained or increasing valuation of the actual living space, suggesting that buyers are willing to pay more for the square footage they desire.
The fluctuating property count, reaching its zenith at 1,074 listings in April 2023 before dipping to a low of 772 in December 2023, hints at potential seasonal trends that influence listing activity. The ebb and flow of inventory could be driven by traditional selling seasons, economic climate, or consumer confidence.
Sold Property Prices in Henderson
A closer look at the average sold prices in Henderson indicates steadiness in overall market activity, with a slight decline from an average sold price of approximately $481,000 in March 2023 to nearly $477,000 in February 2024. The minor reduction of approximately 1% in sold property prices compared to a 4% drop in average listed property values suggests that closing prices maintain a firmer standing during negotiations.
When dissected on a per-square-foot basis, the average sold price takes on a stable front, starting at $262 in March and decreasing to $254 by February of the subsequent year. This 3% reduction is relatively tame and does not echo the same level of volatility seen in the listing price per square foot, reinforcing a market where sellers may have to adjust expectations despite a consistent appetite from buyers for property size and quality.
The fluctuation in the number of sold properties, peaking impressively at 5,312 in November before descending to 4,717 in February, could offer insight into the ideal windows for selling or purchasing property in the region.
As buyers and sellers navigate the shifting currents of Henderson’s real estate market, the data suggests a period where pragmatism reigns. Properties are adjusting to a point where pre-listing valuations are checked, sellers revise their expectations, and sold prices hold steady. This environment is buoyed by consistent interest in space and room attributes, as buyers show willingness to invest in desired square footage.
In summary, Henderson’s real estate market is characterized by adjusting values, steady demand, and the importance of timing for listing and selling activities. Understanding these market dynamics can serve as a powerful tool for prospective buyers, sellers, and investors looking to make informed decisions in this vibrant Nevadan community.
Frequently Asked Questions
Are home prices dropping in Henderson, NV?
Slightly. Average values fell about 4% between March 2023 and February 2024, while sold prices dipped only about 1%.
What is the average sold price in Henderson, NV?
Nearly $477,000 in February 2024, down from about $481,000 in March 2023.

About the author: Manuel Martinez
RealtyTrac contributor
Manuel Martinez is a contributor to RealtyTrac who writes about local housing markets, home buying and real estate investing. He has written for RealtyTrac since 2013, covering city and state market reports, home buying guides and tips, investment financing and strategies for buying and flipping homes.
More in Market Reports
Member Features
Find Real Estate Bargain!
Full foreclosure details
Home value, equity and ownership info
Find homes priced below market
Get full access with a FREE Account
Already a member?
Useful Calculators
- Home Affordability CalculatorThe price range your income and debts support under the 28/36 rule.
- Rent vs. Buy CalculatorThe total cost of owning versus renting over your time in the home.
- Rental Property ROI CalculatorCash flow, NOI, cap rate and cash-on-cash return for a rental.