

Cincinnati Real Estate Market Show Consistent Growth in 2023
Cincinnati’s real estate market has showcased promising growth in 2023, marked by an increase in property values and prices per square foot.


Key Takeaways
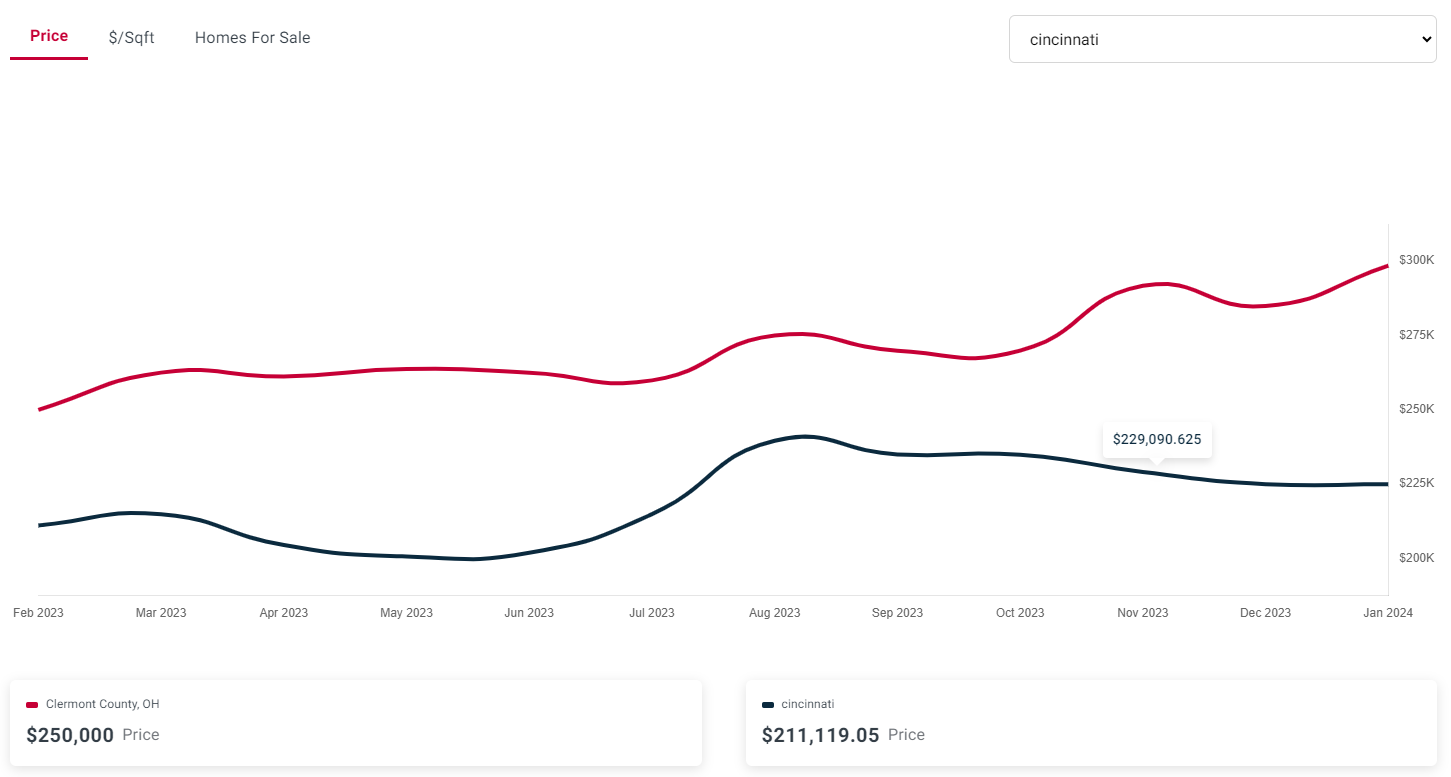
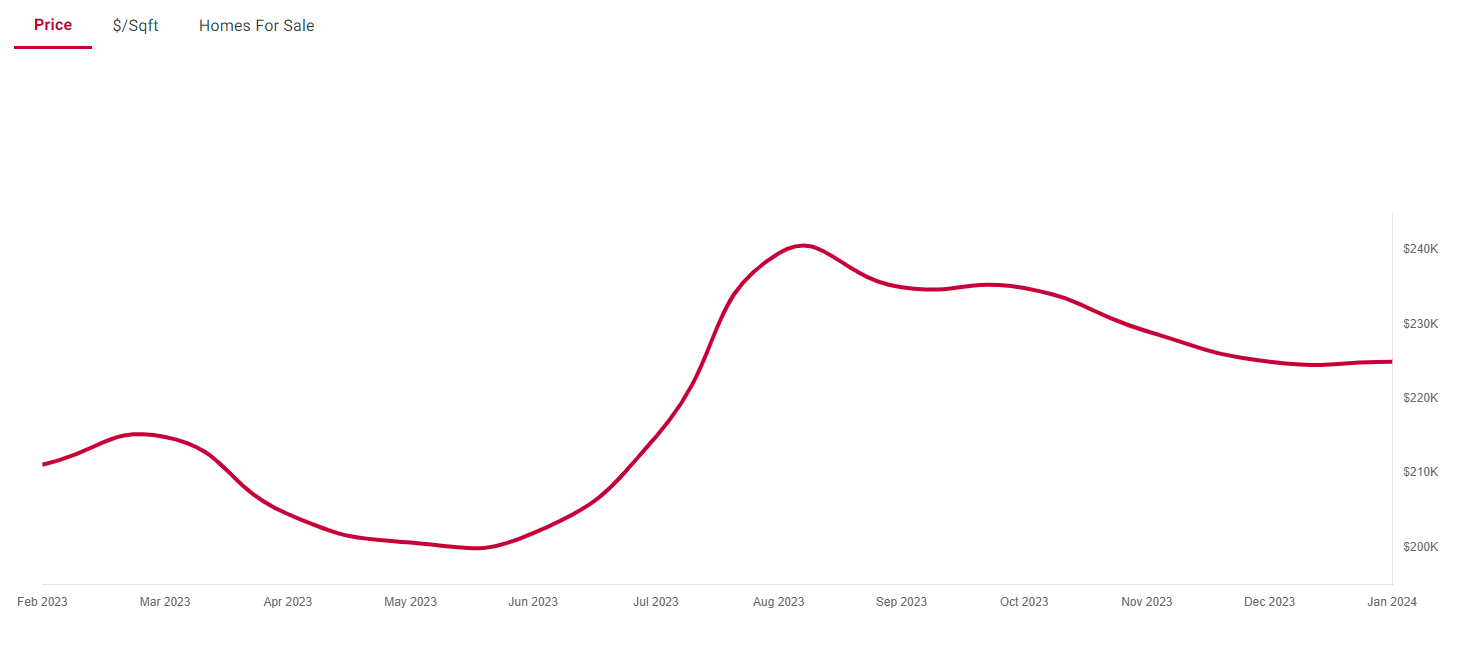
- Cincinnati's average property value rose from about $211,119 in February 2023 to a $239,575 peak in August.
- Sold properties reached an average price of $244,895 in November, at $166 per square foot.
- Sales peaked at 8,810 in September, versus 6,172 in April.
- The median recently sold property value was about $232,859.
Overview of Cincinnati’s Real Estate Market Trends
Cincinnati’s real estate landscape has been characterized by a progressive increase in property values and prices per square foot over recent months. Beginning in February, with average property values at around $211,119 and a price per square foot of $139, there has been a steady climb in these figures. In August, a peak average property value of $239,575, alongside the price per square foot hitting $147, was observed—a testament to the market’s growth in 2023. Interestingly, despite these increases, there is a noted slight dip post-August, hinting at usual market fluctuations.
Simultaneously, when we hone in on sold properties, a parallel trend emerges, with the highest figures noted a bit later in the year. In November, properties were sold at an impressive average price of $244,895, with the price per square foot reaching its zenith at $166. This delay between average property value peaks and sold price peaks could point to shifting buyer behaviors or market adjustments that will be interesting to monitor over time.
Regarding the availability and sales volume of properties, fluctuations are evident throughout the year. A significant high of 802 properties was listed in March, while July saw a notable dip down to just 360 properties on the market. Sold properties showcased a similar pattern, with September proving to be a strong month for sales at 8,810 properties changing hands, as opposed to April’s more modest sales of 6,172 properties.
When placing these monthly trends alongside median values for sold properties, a consistence in market behavior becomes apparent. The median value for recently sold properties standing at $232,859 aligns closely with the average sold prices, reinforcing the observed positive trends in Cincinnati’s real estate market.
Detailed Analysis of Property Values
The real estate scene in Cincinnati has been experiencing encouraging growth, evidenced by the increment in values over time. Specifically, property values showed dynamic growth throughout the months, with the occasional exception which can be linked to a myriad of economic and seasonal factors.
For instance, the property values witnessed a surge from February with its average of $211,119 to a high in August at $239,575. This trend encapsulates a notable increase within just a half-year span. Even with this upswing, seasonality and market corrections presumably played a role in the slight value decline observed after the peak month.
What’s more, this upward pressure on property values seems to create a subsequent impact on the sold prices. This lag in reaction suggests that as valuations rose, it took some time for these to be fully reflected in the actual sales prices transacted by buyers and sellers. By November, sold properties reached an average price of $244,895, demonstrating a potential for property valuations to predict future sold prices.
Monthly Property and Sales Volume Trends
The volume of properties, both listed and sold in Cincinnati, suggests an active market with changing dynamics over the months. Starting the year strong, March showcased a bustling market with a high of 802 properties available. Yet, on the flip side, July saw a contraction to just 360 properties—a stark contrast that highlights the ebb and flow inherent to real estate markets.
Moving to the sales side, September witnessed a remarkable month with 8,810 properties sold, suggesting robust market activity and buyer interest. On the other hand, April’s sales were comparatively lower at 6,172, illustrating the variability month-over-month. These numbers are not just indicators of market health but can also serve as a gauge for buyer sentiment and economic conditions.
Looking deeper into these trends, the fluctuations in both property counts and sales volumes paint a story of a market that, while showing an overall positive trajectory, is not immune to the periodic adjustments which are characteristic of an active and diverse real estate landscape.
While examining the individual monthly trends provides insights into the short-term movements of the market, median values offer a more stable benchmark. The median recently sold property value in Cincinnati standing at nearly $232,859 provides a midpoint that reflects the central tendency of the market’s sold prices, smoothing out extreme values that could skew interpretation.
In conclusion, Cincinnati’s real estate market is not only growing but also demonstrates consistency and stability. With property values, market volume, and median sales prices all trending positively, the market is ripe with opportunity for investors and homeowners alike. Whether through month-over-month analysis or median value comparison, the data indicates that Cincinnati’s real estate is maintaining a healthy and vibrant cycle.
Frequently Asked Questions
Did Cincinnati home values rise in 2023?
Yes. The average property value climbed from about $211,119 in February to a peak of $239,575 in August, with a slight dip afterward.
What is the median sold price in Cincinnati?
The median value for recently sold properties was about $232,859.

About the author: Manuel Martinez
RealtyTrac contributor
Manuel Martinez is a contributor to RealtyTrac who writes about local housing markets, home buying and real estate investing. He has written for RealtyTrac since 2013, covering city and state market reports, home buying guides and tips, investment financing and strategies for buying and flipping homes.
More in Market Reports
Member Features
Find Real Estate Bargain!
Full foreclosure details
Home value, equity and ownership info
Find homes priced below market
Get full access with a FREE Account
Already a member?
Useful Calculators
- Home Affordability CalculatorThe price range your income and debts support under the 28/36 rule.
- Rent vs. Buy CalculatorThe total cost of owning versus renting over your time in the home.
- Rental Property ROI CalculatorCash flow, NOI, cap rate and cash-on-cash return for a rental.

