Member Features
Find Real Estate Bargain!
Full foreclosure details
Home value, equity and ownership info
Find homes priced below market
Get full access with a FREE Account
Already a member?
$861,110
Listing Price4beds
2baths
1,464sqft
6,666sqft lot
2128 Tremont Ave, Simi Valley, CA 93063
Member Features
Find Real Estate Bargain!
Full foreclosure details
Home value, equity and ownership info
Find homes priced below market
Get full access with a FREE Account
Already a member?
For Sale
Off Market
Home type
Price / sqft
Year built
Home Details
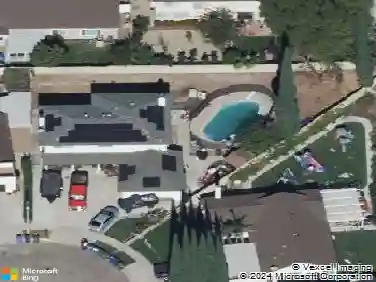
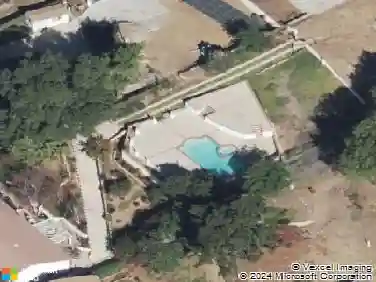
This beautifully upgraded single-story pool home offers 3 bedrooms plus a bonus room (optional 4th), 1,464 sq ft of living space on a 6,534 sq ft lot, and the best curb appeal in the neighborhood. Inside, you'll find vaulted ceilings, slate flooring, a cozy fireplace, and a stunning chef's kitchen featuring an oversized granite island, abundant pantry space, stainless steel LG appliances, and a commercial-size refrigerator. The remodeled primary suite and bathroom includes dual closets, vaulted ceilings, backyard access, and a spa-like bathroom with double sinks and a heated bidet. Designed for true indoor-outdoor living, the entertainer's backyard showcases a pool, spa, built-in BBQ, covered patio, fire pit, two storage sheds, and sweeping 360 views. Major upgrades include a new roof, new AC, new front windows, updated garage door, custom aluminum gates, app-controlled lighting, LED recessed lights, and more. Conveniently located near parks, hiking trails, award-winning schools, shopping, dining, and easy access to the 118 freeway. A rare turnkey opportunity combining style, comfort, and lifestyle!
Interior Details
1464
4
2
Has Heating:
No
Heating Type:
N/A
Has Cooling:
No
Cooling Type:
N/A
Has Fuel:
No
Fuel Type:
N/A
Has Basement:
No
Basement Type:
N/A
Has Flooring:
No
Flooring Type:
N/A
Has Fireplace:
Yes
Fireplace Type:
N/A
Property Details
6666
No
No
Type:
N/A
Location:
N/A
Status:
N/A
Number of Spaces:
N/A
N/A
N/A
N/A
N/A
N/A
N/A
N/A
Construction Details
N/A
N/A
N/A
N/A
N/A
Tax History
Year
Amount
Land
Improvement
Percent Change
Assessment
2020
$5,361
$219,934
$219,934
--%
$439,868
2019
$9,835
$215,622
$215,622
--%
$431,244
2018
$9,785
$211,395
$211,395
--%
$422,790
2017
$9,651
$207,250
$207,250
--%
$414,500
2016
$4,733
$203,187
$203,187
--%
$406,374
2014
$4,581
$196,216
$196,216
--%
$392,432
2013
$4,610
$195,330
$195,330
--%
$390,660
2012
$4,498
$187,000
$187,000
--%
$374,000

Average Home Price in 93063
Nearby Properties
Zip Code
Price
Bed
Bath
Sqft
Lot
Sold Date
$841,432
4 Beds
2 Baths
1,464 Sqft
6,500 Lot (sqft)
Sold 06/29/2026
$892,500
4 Beds
2 Baths
1,554 Sqft
6,500 Lot (sqft)
Sold 10/26/2026
$875,456
3 Beds
2.5 Baths
1,659 Sqft
4,256 Lot (sqft)
Sold 10/27/2026
$778,998
3 Beds
2 Baths
1,539 Sqft
7,291 Lot (sqft)
Sold 10/27/2026
$781,006
$781,006
3 Beds
2 Baths
1,478 Sqft
4,290 Lot (sqft)
Sold 10/26/2026
$810,000
3 Beds
2 Baths
1,268 Sqft
7,980 Lot (sqft)
Sold 10/27/2026
$833,057
3 Beds
2 Baths
1,420 Sqft
6,500 Lot (sqft)
Sold 10/27/2026
$725,000
$725,000
3 Beds
2 Baths
1,420 Sqft
10,880 Lot (sqft)
Sold 10/13/2026
$799,000
4 Beds
2 Baths
1,554 Sqft
6,550 Lot (sqft)
Sold 10/27/2026