Member Features
Find Real Estate Bargain!
Full foreclosure details
Home value, equity and ownership info
Find homes priced below market
Get full access with a FREE Account
Already a member?
$450,000
Listing Price3beds
3baths
1,430sqft
1,188sqft lot
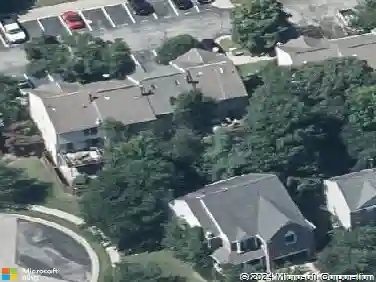
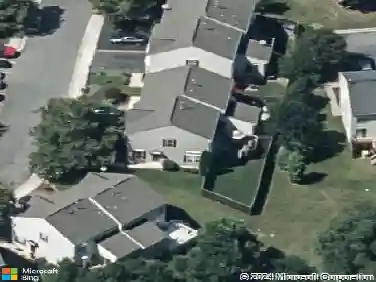
8725 Spring Brook Way, Odenton, MD 21113
Member Features
Find Real Estate Bargain!
Full foreclosure details
Home value, equity and ownership info
Find homes priced below market
Get full access with a FREE Account
Already a member?
For Sale
Off Market
Home type
Price / sqft
Year built
Home Details
Move-in ready in sought-after Piney Orchard!nThis well-maintained home features a newly updated primary bathroom, adding a modern touch to an already spacious layout. Major systems have been thoughtfully updated, including a new roof and windows (2023) and HVAC (2022) providing peace of mind for years to come.nnEnjoy three fully finished levels offering flexible living space for entertaining, working from home, or everyday living. Step outside to a fenced in front patio, perfect for added privacy, pets, or outdoor gatherings.nnLocated in the amenity-rich Piney Orchard community, residents enjoy access to indoor and outdoor pools, fitness center, clubhouse, walking and biking trails, playgrounds, and don't forget the pickleball courts! The association fee includes water, trash, snow removal, common area maintenance, and management, making for easy, low-maintenance living.nnA well cared for home in a prime community, updated where it matters and ready for its next owner.
Interior Details
1430
3
3
Has Heating:
Yes
Heating Type:
Yes
Has Cooling:
Yes
Cooling Type:
Central
Has Fuel:
No
Fuel Type:
N/A
Has Basement:
No
Basement Type:
No Basement
Has Flooring:
No
Flooring Type:
N/A
Has Fireplace:
Yes
Fireplace Type:
N/A
Property Details
1188
Yes
Yes
Type:
N/A
Location:
N/A
Status:
N/A
Number of Spaces:
N/A
N/A
N/A
N/A
N/A
N/A
N/A
N/A
Construction Details
Townhouse
Siding (not Specified)
N/A
N/A
Composition Shingle
Tax History
Year
Amount
Land
Improvement
Percent Change
Assessment
2021
$3,051
$0
$0
--%
$277,667
2020
$3,004
$150,000
$125,000
--%
$275,000
2019
$2,860
$0
$0
--%
$262,700
2018
$2,815
$0
$0
--%
$250,400
2017
$2,777
$130,000
$108,100
--%
$238,100
2015
$2,837
$130,000
$108,100
--%
$238,100
2014
$2,870
$100,000
$140,300
--%
$240,300
2012
$2,828
$0
$0
--%
$240,300

Average Home Price in 21113
Nearby Properties
Zip Code
Price
Bed
Bath
Sqft
Lot
Sold Date
$401,252
-- Beds
2 Baths
1,600 Sqft
1,600 Lot (sqft)
Sold 10/28/2026
$410,493
-- Beds
2 Baths
1,430 Sqft
1,254 Lot (sqft)
Sold 10/20/2026
$369,407
-- Beds
-- Baths
1,500 Sqft
1,500 Lot (sqft)
Sold 10/09/2026
$375,735
-- Beds
-- Baths
1,500 Sqft
1,500 Lot (sqft)
Sold 10/08/2026
$414,296
-- Beds
2 Baths
1,594 Sqft
1,600 Lot (sqft)
Sold 08/21/2026
$351,015
-- Beds
2 Baths
1,400 Sqft
1,400 Lot (sqft)
Sold 06/22/2026
$412,840
-- Beds
2 Baths
1,430 Sqft
1,188 Lot (sqft)
Sold 06/22/2026
$375,000
$375,000
-- Beds
2 Baths
1,534 Sqft
4,500 Lot (sqft)
Sold 06/11/2026
$418,632
$418,632
-- Beds
2 Baths
1,484 Sqft
5,000 Lot (sqft)
Sold 10/27/2026