Member Features
Find Real Estate Bargain!
Full foreclosure details
Home value, equity and ownership info
Find homes priced below market
Get full access with a FREE Account
Already a member?
$649,900
Listing Price3beds
1baths
1,056sqft
9,280sqft lot
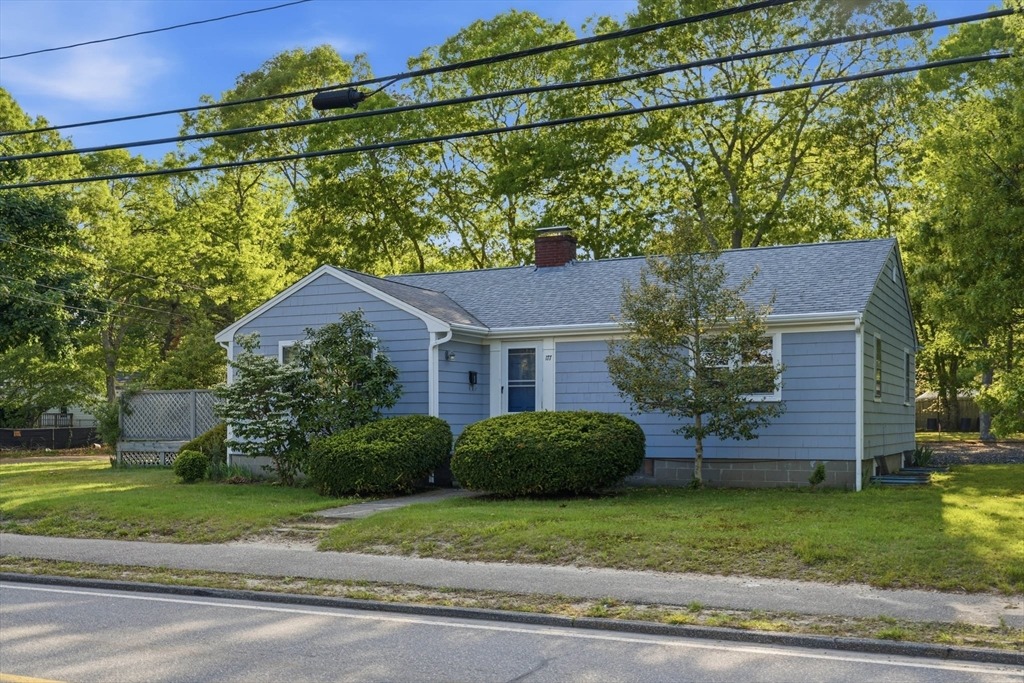
177 Seacoast Shores Blvd, East Falmouth, MA 02536
Member Features
Find Real Estate Bargain!
Full foreclosure details
Home value, equity and ownership info
Find homes priced below market
Get full access with a FREE Account
Already a member?
For Sale
Off Market
Home type
Price / sqft
Year built
Home Details
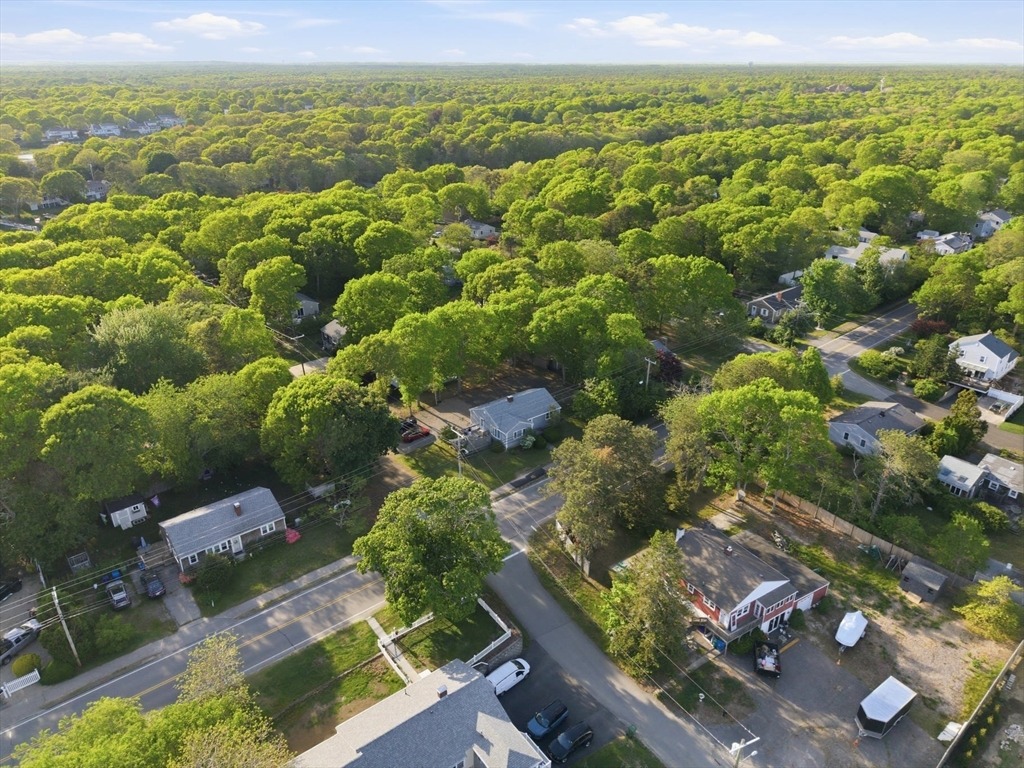
Beautiful ranch home in the highly desirable Seacoast Shores community! Featuring 3 good-sized bedrooms and 1.5 baths, this home offers the perfect blend of comfort, style, and coastal charm. The stunning kitchen has been thoughtfully updated with gorgeous cabinetry, Quartz countertops, and stainless steel appliances, creating a bright and functional space. The spacious living room is filled with natural light thanks to an abundance of windows and offers plenty of room to relax. Hardwood flooring runs throughout much of the first floor, while the kitchen features durable laminate flooring. The finished lower level provides valuable additional living space perfect for a family room, home office, gym, or playroom, along with ample storage and a convenient half bath. Located in beautiful Seacoast Shores, this home is just a short walk to the water, allowing you to enjoy all the benefits of coastal living in one of Falmouths most sought-after neighborhoods. Home has audio/visual cameras.
Interior Details
1056
3
1
Has Heating:
Yes
Heating Type:
Hot Water
Has Cooling:
No
Cooling Type:
N/A
Has Fuel:
Yes
Fuel Type:
Oil
Has Basement:
No
Basement Type:
Unfinished
Has Flooring:
No
Flooring Type:
N/A
Has Fireplace:
Yes
Fireplace Type:
N/A
Property Details
9280
No
No
Type:
N/A
Location:
N/A
Status:
N/A
Number of Spaces:
N/A
N/A
N/A
N/A
N/A
N/A
N/A
N/A
Construction Details
Ranch
Wood Siding
N/A
Gable
Asphalt
Tax History
Year
Amount
Land
Improvement
Percent Change
Assessment
2020
$1,935
$97,700
$127,600
--%
$225,300
2019
$1,863
$97,700
$119,900
--%
$217,600
2018
$1,821
$97,700
$114,000
--%
$211,700
2017
$1,775
$97,700
$110,400
--%
$208,100
2016
$1,742
$97,700
$110,400
--%
$208,100
2014
$1,642
$102,800
$98,700
--%
$201,500
2013
$1,570
$102,800
$92,500
--%
$195,300

Average Home Price in 02536
Nearby Properties
Zip Code
Price
Bed
Bath
Sqft
Lot
Sold Date
$557,841
3 Beds
2.5 Baths
1,012 Sqft
7,520 Lot (sqft)
Sold 09/16/2026
$489,000
$489,000
3 Beds
1 Baths
960 Sqft
7,780 Lot (sqft)
Sold 10/13/2026
$535,249
2 Beds
1 Baths
970 Sqft
7,520 Lot (sqft)
Sold 10/13/2026
$800,592
5 Beds
2 Baths
1,132 Sqft
9,600 Lot (sqft)
Sold 10/13/2026
$534,900
3 Beds
1 Baths
960 Sqft
7,700 Lot (sqft)
Sold 10/13/2026
$1,399,000
$1,399,000
3 Beds
1.5 Baths
1,053 Sqft
11,900 Lot (sqft)
Sold 10/18/2026
$2,261,083
$2,261,083
2 Beds
2 Baths
1,200 Sqft
22,200 Lot (sqft)
Sold 10/13/2026
$497,240
3 Beds
1 Baths
936 Sqft
8,120 Lot (sqft)
Sold 10/18/2026
$639,900
2 Beds
1 Baths
936 Sqft
8,120 Lot (sqft)
Sold 10/13/2026