Member Features
Find Real Estate Bargain!
Full foreclosure details
Home value, equity and ownership info
Find homes priced below market
Get full access with a FREE Account
Already a member?
$953,865
Sold Price3beds
2baths
1,426sqft
6,000sqft lot
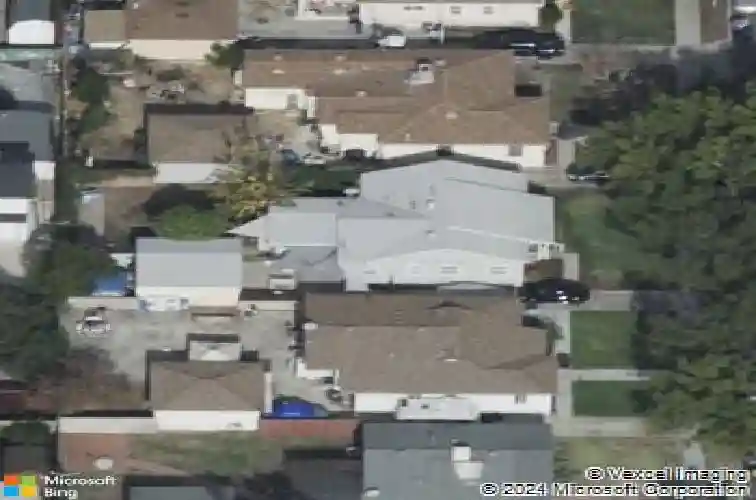
2029 N Rose St, Burbank, CA 91505
Member Features
Find Real Estate Bargain!
Full foreclosure details
Home value, equity and ownership info
Find homes priced below market
Get full access with a FREE Account
Already a member?
Recently Sold
Off Market
Home type
Price / sqft
Year built
Home Details
Interior Details
1426
3
2
Has Heating:
Yes
Heating Type:
Central
Has Cooling:
Yes
Cooling Type:
Central
Has Fuel:
No
Fuel Type:
N/A
Has Basement:
No
Basement Type:
N/A
Has Flooring:
No
Flooring Type:
N/A
Has Fireplace:
Yes
Fireplace Type:
N/A
Property Details
6000
No
No
Type:
N/A
Location:
N/A
Status:
N/A
Number of Spaces:
N/A
N/A
N/A
N/A
N/A
N/A
N/A
N/A
Construction Details
Conventional
Stucco
N/A
Gable
Composition Shingle
Tax History
Year
Amount
Land
Improvement
Percent Change
Assessment
2019
$4,008
$241,387
$115,258
--%
$356,645
2019
$4,008
$236,654
$112,999
--%
$349,653
2018
$3,914
$232,014
$110,784
--%
$342,798
2017
$3,832
$227,465
$108,612
--%
$336,077
2016
$3,709
$223,005
$106,483
--%
$329,488
2014
$3,631
$215,354
$102,830
--%
$318,184
2013
$3,601
$214,381
$102,366
--%
$316,747
2012
$3,439
$210,178
$100,359
--%
$310,537

Average Home Price in 91505
Nearby Properties
Zip Code
Price
Bed
Bath
Sqft
Lot
Sold Date
$860,698
$860,698
3 Beds
2 Baths
1,363 Sqft
6,750 Lot (sqft)
Sold 10/08/2026
$968,467
$968,467
3 Beds
2 Baths
1,583 Sqft
6,000 Lot (sqft)
Sold 09/16/2026
$859,317
$859,317
3 Beds
1 Baths
1,306 Sqft
6,000 Lot (sqft)
Sold 09/09/2026
$958,244
$958,244
3 Beds
2 Baths
1,330 Sqft
6,034 Lot (sqft)
Sold 08/19/2026
$869,747
$869,747
4 Beds
1 Baths
1,296 Sqft
6,575 Lot (sqft)
Sold 07/07/2026
$988,414
$988,414
4 Beds
2 Baths
1,514 Sqft
8,478 Lot (sqft)
Sold 06/23/2026
$970,424
$970,424
3 Beds
2 Baths
1,480 Sqft
5,999 Lot (sqft)
Sold 05/29/2026
$953,865
$953,865
3 Beds
2 Baths
1,426 Sqft
6,000 Lot (sqft)
Sold 05/26/2026
$1,155,768
$1,155,768
3 Beds
2 Baths
1,500 Sqft
6,000 Lot (sqft)
Sold 10/13/2026
Calculators
Mortgage
Mortgage Calculator
Details for 2029 N ROSE ST
Property Debt
Foreclosure Contact Details
Similar Homes Nearby

Guides for Rose St

In August 2024, LA’s pre-foreclosures plummeted 50% from July and 60% from last year, suggesting better economic conditions or successful homeowner interventions. Similar trends in San Jose, while SF and SD remain stable. Sacramento shows significant improvement. LA’s efforts stand out. #HousingMarket #LosAngeles