Member Features
Find Real Estate Bargain!
Full foreclosure details
Home value, equity and ownership info
Find homes priced below market
Get full access with a FREE Account
Already a member?
$1,100,000
Listing Price5beds
3baths
1,786sqft
5,995sqft lot
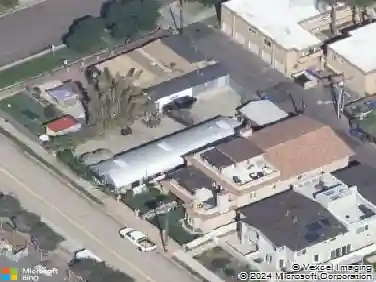
767 Rivertree Dr, Oceanside, CA 92058
Member Features
Find Real Estate Bargain!
Full foreclosure details
Home value, equity and ownership info
Find homes priced below market
Get full access with a FREE Account
Already a member?
For Sale
Off Market
Home type
Price / sqft
Year built
Home Details
Significant Price Drop $999,000 - Priced to Sell Now ! Seller's are relocating and highly motivated to sell. The price has been reduced to encourage a fast sale, creating a great opportunity for buyers... Ideally located within walking distance to the Ocean Kamp under construction of an exciting new Wave Pool & Surf Park. The development will feature a stunning 3.5-acre wave lagoon, set to become San Diego Countys first artificial surf park, with technology similar to the renowned Palm Springs Surf Club. This is a rare opportunity to own in a growing, high-demand coastal area with strong potential a few miles from the beach and harbor which is easily accessible by the SLR River Trail without HOA ! This special gem has been meticulously cared for and upgraded including a new furnace, new air conditioning and new water heater. Act quickly-this home is priced to sell and wont last !
Interior Details
1786
5
3
Has Heating:
No
Heating Type:
N/A
Has Cooling:
No
Cooling Type:
N/A
Has Fuel:
No
Fuel Type:
N/A
Has Basement:
No
Basement Type:
N/A
Has Flooring:
No
Flooring Type:
N/A
Has Fireplace:
Yes
Fireplace Type:
N/A
Property Details
5995
No
No
Type:
Carport (unspecified)
Location:
N/A
Status:
N/A
Number of Spaces:
3
N/A
N/A
N/A
N/A
N/A
N/A
N/A
Construction Details
N/A
N/A
N/A
N/A
N/A
Tax History
Year
Amount
Land
Improvement
Percent Change
Assessment
2020
$5,375
$281,896
$196,639
--%
$478,535
2019
$5,220
$276,369
$192,784
--%
$469,153
2018
$5,164
$270,950
$189,004
--%
$459,954
2017
$5,070
$265,638
$185,299
--%
$450,937
2016
$4,906
$260,430
$181,666
--%
$442,096
2014
$4,579
$251,495
$175,433
--%
$426,928
2013
$3,741
$205,000
$143,000
--%
$348,000
2012
$3,454
$190,000
$131,000
--%
$321,000

Average Home Price in 92058
Nearby Properties
Zip Code
Price
Bed
Bath
Sqft
Lot
Sold Date
$784,981
3 Beds
2.5 Baths
1,638 Sqft
8,083 Lot (sqft)
Sold 10/14/2026
$1,016,414
$1,016,414
3 Beds
2.5 Baths
1,725 Sqft
11,058 Lot (sqft)
Sold 09/18/2026
$1,043,221
$1,043,221
4 Beds
2.5 Baths
1,968 Sqft
191,228 Lot (sqft)
Sold 08/07/2026
$814,818
3 Beds
2.5 Baths
1,725 Sqft
7,923 Lot (sqft)
Sold 07/08/2026
$1,136,457
$1,136,457
4 Beds
2.5 Baths
1,806 Sqft
7,886 Lot (sqft)
Sold 06/10/2026
$983,834
4 Beds
3 Baths
1,786 Sqft
6,998 Lot (sqft)
Sold 05/26/2026
$861,144
3 Beds
2 Baths
1,522 Sqft
12,274 Lot (sqft)
Sold 05/08/2026
$1,000,000
$1,000,000
3 Beds
2.5 Baths
1,638 Sqft
13,398 Lot (sqft)
Sold 10/13/2026
$993,745
4 Beds
3 Baths
1,782 Sqft
5,709 Lot (sqft)
Sold 10/13/2026
Calculators
Mortgage
Mortgage Calculator
Details for 767 RIVERTREE DR
Property Debt
Foreclosure Contact Details
Similar Homes Nearby

Guides for Rivertree Dr

San Diego’s average home values have gone up and down; sale prices per square foot showing a trend. Surrounding cities in southern California reflect varied market health, recent data shows.