Member Features
Find Real Estate Bargain!
Full foreclosure details
Home value, equity and ownership info
Find homes priced below market
Get full access with a FREE Account
Already a member?
$650,000
Listing Price4beds
2baths
2,185sqft
8,510sqft lot
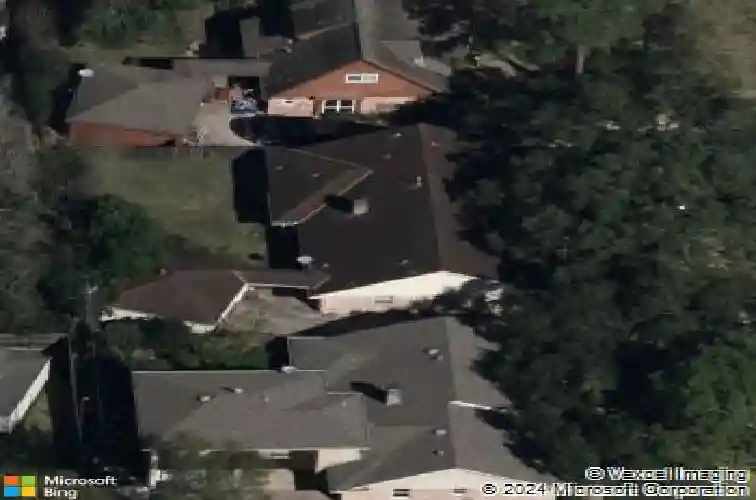
823 Pinesap Dr, Houston, TX 77079
Member Features
Find Real Estate Bargain!
Full foreclosure details
Home value, equity and ownership info
Find homes priced below market
Get full access with a FREE Account
Already a member?
For Sale
Home type
Price / sqft
Year built
Home Details
A beautifully updated 4-bedroom, 2-bath one-story home tucked on a wonderful cul-de-sac in the heart of Thornwood. Abundant natural light, an open floor plan made for everyday living and entertaining, and a long list of recent updates: new roof, HVAC, water heater, front door, and recessed lighting throughout. The beautifully expanded kitchen features ample counter space, plenty of built-ins, custom light fixtures and charming breakfast area. Large, bright dining room. Flex room off of the kitchen is perfect for a home office or playroom. The primary suite highlights a walk-in closet and a remodeled bath with dual shower heads and double vanity. Fresh carpet and beautiful engineered hardwood floors. Covered patio and large detached 2-car garage with extra storage. Two neighborhood pools, close to dining and shopping, easy commuter access. Zoned to Nottingham Elementary. This gem won't last long!
Interior Details
2185
4
2
Has Heating:
Yes
Heating Type:
Central
Has Cooling:
Yes
Cooling Type:
Central
Has Fuel:
Yes
Fuel Type:
Gas
Has Basement:
No
Basement Type:
N/A
Has Flooring:
No
Flooring Type:
N/A
Has Fireplace:
Yes
Fireplace Type:
N/A
Property Details
8510
Yes
Yes
Type:
Garage, Detached
Location:
N/A
Status:
N/A
Number of Spaces:
2
No
No
No
No
No
No
No
Construction Details
Traditional/old
Brick/masonry
N/A
N/A
N/A
Tax History
Year
Amount
Land
Improvement
Percent Change
Assessment
2020
$11,009
$211,313
$233,799
--%
$445,112
2019
$11,152
$211,313
$233,799
--%
$445,112
2018
$11,922
$211,313
$244,079
--%
$455,392
2017
$11,419
$0
$0
--%
$436,887
2016
$10,390
$0
$0
--%
$397,170
2015
$9,499
$169,050
$180,950
--%
$350,000
2013
$7,966
$101,430
$196,970
--%
$298,400
2012
$11,633
$0
$0
--%
$300,074

Average Home Price in 77079
Nearby Properties
Zip Code
Price
Bed
Bath
Sqft
Lot
Sold Date
$279,696
$279,696
4 Beds
2.5 Baths
2,464 Sqft
1,558 Lot (sqft)
Sold 07/30/2026
$270,001
$270,001
3 Beds
2.5 Baths
2,090 Sqft
2,116 Lot (sqft)
Sold 07/01/2026