Member Features
Find Real Estate Bargain!
Full foreclosure details
Home value, equity and ownership info
Find homes priced below market
Get full access with a FREE Account
Already a member?
$781,949
Sold Price2beds
1baths
1,220sqft
4,232sqft lot
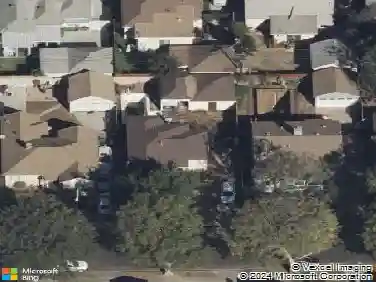
529 W Olive St, Inglewood, CA 90301
Member Features
Find Real Estate Bargain!
Full foreclosure details
Home value, equity and ownership info
Find homes priced below market
Get full access with a FREE Account
Already a member?
Recently Sold
Off Market
Home type
Price / sqft
Year built
Home Details
Interior Details
1220
2
1
Has Heating:
Yes
Heating Type:
Floor/wall Furnace
Has Cooling:
No
Cooling Type:
N/A
Has Fuel:
No
Fuel Type:
N/A
Has Basement:
No
Basement Type:
N/A
Has Flooring:
No
Flooring Type:
N/A
Has Fireplace:
Yes
Fireplace Type:
N/A
Property Details
4232
No
No
Type:
N/A
Location:
N/A
Status:
N/A
Number of Spaces:
N/A
N/A
N/A
N/A
N/A
N/A
N/A
N/A
Construction Details
Conventional
Stucco
N/A
Flat
Roll Composition (rolled Mineral Roof)
Tax History
Year
Amount
Land
Improvement
Percent Change
Assessment
2019
$2,204
$109,931
$36,008
--%
$145,939
2019
$2,204
$107,776
$35,302
--%
$143,078
2018
$2,133
$105,663
$34,610
--%
$140,273
2017
$2,073
$103,592
$33,932
--%
$137,524
2016
$2,014
$101,561
$33,267
--%
$134,828
2014
$1,995
$98,077
$32,127
--%
$130,204
2013
$1,984
$97,634
$31,982
--%
$129,616
2012
$1,859
$95,720
$31,355
--%
$127,075

Average Home Price in 90301
Nearby Properties
Zip Code
Price
Bed
Bath
Sqft
Lot
Sold Date
$742,687
$742,687
2 Beds
1 Baths
1,275 Sqft
7,126 Lot (sqft)
Sold 10/08/2026
$625,816
$625,816
3 Beds
1 Baths
1,204 Sqft
5,733 Lot (sqft)
Sold 09/11/2026
$641,175
3 Beds
1 Baths
1,160 Sqft
4,089 Lot (sqft)
Sold 09/10/2026
$658,356
$658,356
3 Beds
2 Baths
1,092 Sqft
4,524 Lot (sqft)
Sold 08/06/2026
$875,731
$875,731
3 Beds
2 Baths
1,112 Sqft
4,554 Lot (sqft)
Sold 10/27/2026
$689,000
3 Beds
2 Baths
1,077 Sqft
3,938 Lot (sqft)
Sold 10/26/2026
$588,408
$588,408
3 Beds
1 Baths
1,370 Sqft
5,373 Lot (sqft)
Sold 10/26/2026
$761,395
$761,395
2 Beds
1.5 Baths
1,090 Sqft
4,825 Lot (sqft)
Sold 10/26/2026
$1,499,000
$1,499,000
3 Beds
2 Baths
1,299 Sqft
5,497 Lot (sqft)
Sold 10/26/2026
Calculators
Mortgage
Mortgage Calculator
Details for 529 W OLIVE ST
Property Debt
Foreclosure Contact Details
Similar Homes Nearby

Guides for Olive St

In August 2024, LA’s pre-foreclosures plummeted 50% from July and 60% from last year, suggesting better economic conditions or successful homeowner interventions. Similar trends in San Jose, while SF and SD remain stable. Sacramento shows significant improvement. LA’s efforts stand out. #HousingMarket #LosAngeles