Member Features
Find Real Estate Bargain!
Full foreclosure details
Home value, equity and ownership info
Find homes priced below market
Get full access with a FREE Account
Already a member?
$725,000
Listing Price4beds
2.5baths
2,718sqft
39,610sqft lot
1029 Oakridge Ct, Burleson, TX 76028
Member Features
Find Real Estate Bargain!
Full foreclosure details
Home value, equity and ownership info
Find homes priced below market
Get full access with a FREE Account
Already a member?
For Sale
Off Market
Home type
Price / sqft
Year built
Home Details
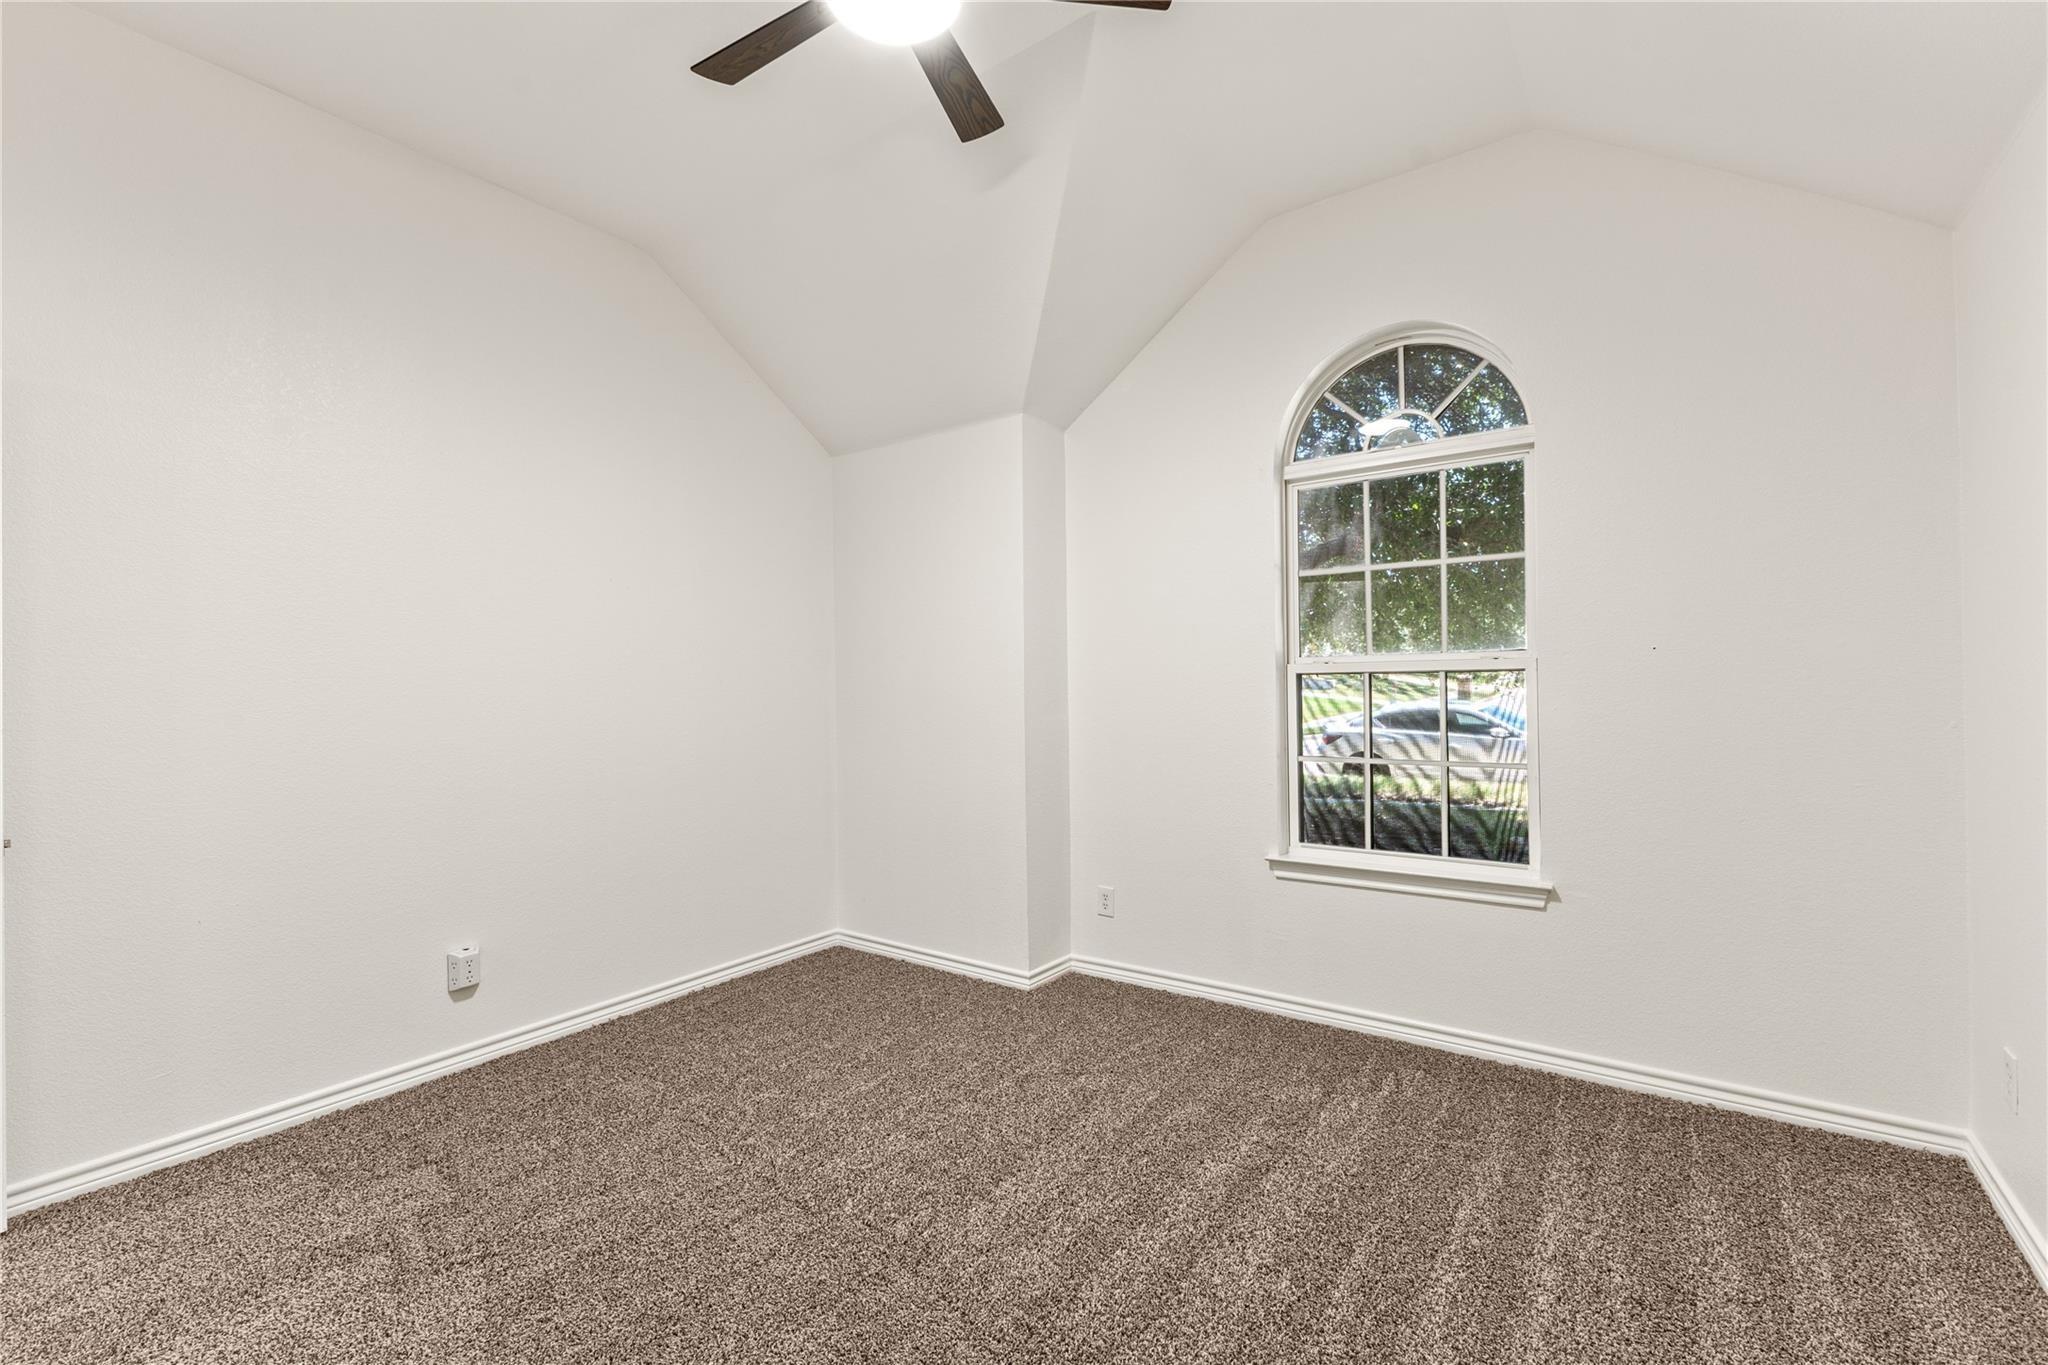
Welcome to 1029 Oakridge Ct, a beautifully maintained home tucked away on a quiet cul-de-sac in the heart of Burleson. This inviting property offers the perfect blend of comfort, functionality, and location. Step inside to find a spacious, open-concept layout with abundant natural light, ideal for both everyday living and entertaining. The kitchen features ample counter space, modern appliances, and a seamless flow into the main living and dining areas. The primary suite provides a private retreat with a well-appointed ensuite bath and generous closet space. Secondary bedrooms are nicely sized, offering flexibility for family, guests, or a home office. Outside, enjoy a large backyard with plenty of room for relaxing, entertaining, or swimming in the pool. The cul-de-sac location offers minimal traffic and added privacy, making it perfect for families. Conveniently located near top-rated schools, shopping, dining, and with easy access to major highways, this home combines suburban tranquility with city convenience. Dont miss your opportunity to own a great home in one of Burlesons desirable neighborhoods!
Interior Details
2718
4
2.5
Has Heating:
No
Heating Type:
N/A
Has Cooling:
No
Cooling Type:
N/A
Has Fuel:
No
Fuel Type:
N/A
Has Basement:
No
Basement Type:
N/A
Has Flooring:
No
Flooring Type:
N/A
Has Fireplace:
Yes
Fireplace Type:
N/A
Property Details
39610
No
No
Type:
Garage, Attached
Location:
N/A
Status:
N/A
Number of Spaces:
0
No
No
No
No
No
No
No
Construction Details
N/A
N/A
N/A
N/A
N/A
Tax History
Year
Amount
Land
Improvement
Percent Change
Assessment
2020
$6,322
$0
$0
--%
$312,467
2019
$5,832
$0
$0
--%
$284,061
2018
$5,686
$0
$0
--%
$258,237
2017
$5,169
$0
$0
--%
$234,761
2016
$4,395
$35,000
$178,419
--%
$213,419
2013
$4,311
$35,000
$178,419
--%
$213,419
2013
$4,311
$35,000
$178,419
--%
$213,419
2012
$4,192
$0
$0
--%
$213,419

Average Home Price in 76028