Member Features
Find Real Estate Bargain!
Full foreclosure details
Home value, equity and ownership info
Find homes priced below market
Get full access with a FREE Account
Already a member?
$1,261,782
Sold Price3beds
2baths
1,610sqft
4,500sqft lot
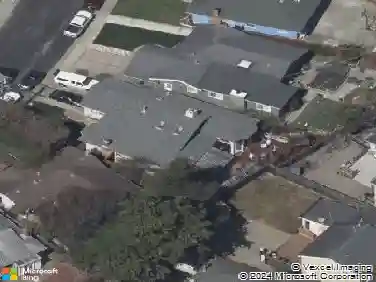
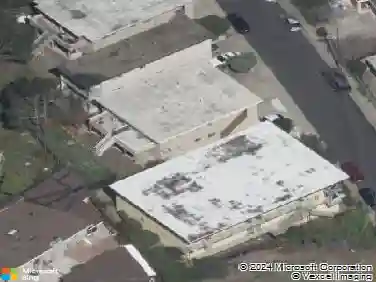
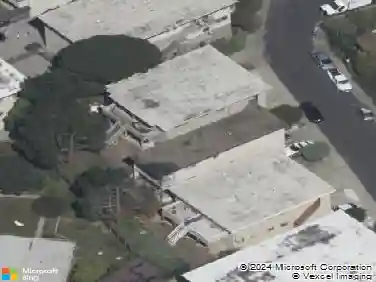
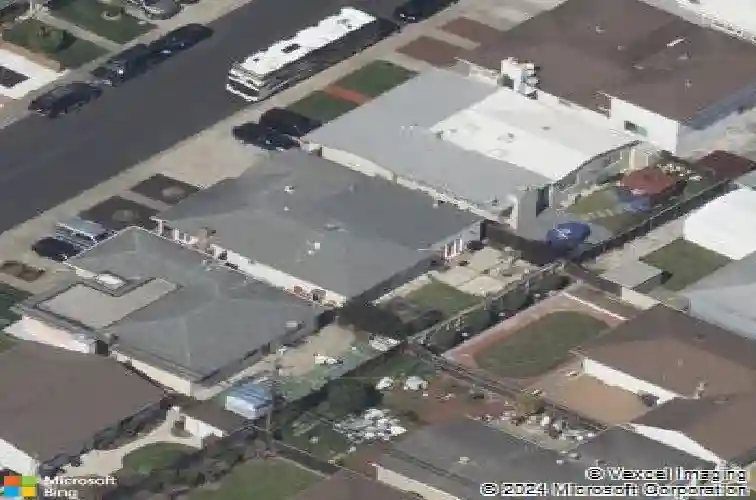
169 Nyla Ave, South San Francisco, CA 94080
Member Features
Find Real Estate Bargain!
Full foreclosure details
Home value, equity and ownership info
Find homes priced below market
Get full access with a FREE Account
Already a member?
Recently Sold
Off Market
Home type
Price / sqft
Year built
Home Details
Interior Details
1610
3
2
Has Heating:
Yes
Heating Type:
Central
Has Cooling:
Yes
Cooling Type:
Central
Has Fuel:
No
Fuel Type:
N/A
Has Basement:
No
Basement Type:
N/A
Has Flooring:
No
Flooring Type:
N/A
Has Fireplace:
Yes
Fireplace Type:
N/A
Property Details
4500
No
No
Type:
N/A
Location:
N/A
Status:
N/A
Number of Spaces:
N/A
N/A
N/A
N/A
N/A
N/A
N/A
N/A
Construction Details
N/A
N/A
N/A
N/A
N/A
Tax History
Year
Amount
Land
Improvement
Percent Change
Assessment
2020
$4,949
$179,994
$221,152
--%
$401,146
2019
$4,898
$176,465
$216,817
--%
$393,282
2018
$4,782
$173,005
$212,567
--%
$385,572
2017
$4,642
$169,613
$208,400
--%
$378,013
2016
$4,516
$166,288
$204,314
--%
$370,602
2014
$4,341
$160,583
$197,304
--%
$357,887
2013
$4,273
$159,858
$196,413
--%
$356,271
2012
$4,093
$156,724
$192,562
--%
$349,286

Average Home Price in 94080
Nearby Properties
Zip Code
Price
Bed
Bath
Sqft
Lot
Sold Date
$1,158,882
$1,158,882
3 Beds
2 Baths
1,430 Sqft
4,500 Lot (sqft)
Sold 10/24/2026
$1,731,703
3 Beds
2.5 Baths
1,610 Sqft
4,230 Lot (sqft)
Sold 10/20/2026
$1,271,188
4 Beds
2 Baths
1,607 Sqft
4,311 Lot (sqft)
Sold 10/09/2026
$1,307,602
3 Beds
2 Baths
1,460 Sqft
4,864 Lot (sqft)
Sold 09/10/2026
$1,269,953
3 Beds
2 Baths
1,770 Sqft
6,504 Lot (sqft)
Sold 09/10/2026
$1,547,717
3 Beds
2 Baths
1,510 Sqft
5,722 Lot (sqft)
Sold 08/14/2026
$1,307,395
3 Beds
2 Baths
1,550 Sqft
4,864 Lot (sqft)
Sold 06/22/2026
$1,129,459
2 Beds
1 Baths
1,430 Sqft
5,225 Lot (sqft)
Sold 06/15/2026
$1,278,325
3 Beds
2.5 Baths
1,680 Sqft
4,305 Lot (sqft)
Sold 06/04/2026