Member Features
Find Real Estate Bargain!
Full foreclosure details
Home value, equity and ownership info
Find homes priced below market
Get full access with a FREE Account
Already a member?
$574,008
Sold Price4beds
2.5baths
1,734sqft
7,475sqft lot
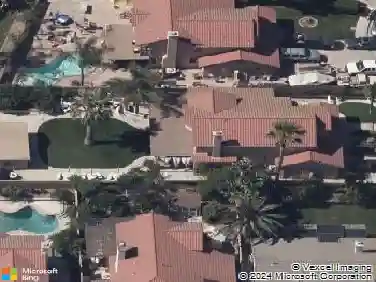
2043 E Mulberry Ct, Ontario, CA 91764
Member Features
Find Real Estate Bargain!
Full foreclosure details
Home value, equity and ownership info
Find homes priced below market
Get full access with a FREE Account
Already a member?
Recently Sold
Off Market
Home type
Price / sqft
Year built
Home Details
Interior Details
1734
4
2.5
Has Heating:
Yes
Heating Type:
Floor/wall Furnace
Has Cooling:
Yes
Cooling Type:
None
Has Fuel:
No
Fuel Type:
N/A
Has Basement:
No
Basement Type:
N/A
Has Flooring:
No
Flooring Type:
N/A
Has Fireplace:
Yes
Fireplace Type:
N/A
Property Details
7475
Yes
Yes
Type:
Garage, Attached
Location:
N/A
Status:
N/A
Number of Spaces:
2
No
Yes
No
No
No
No
No
Construction Details
Modern
Stucco
N/A
N/A
Composition Shingle
Tax History
Year
Amount
Land
Improvement
Percent Change
Assessment
2020
$1,772
$31,851
$138,669
--%
$170,520
2019
$1,761
$31,226
$135,950
--%
$167,176
2018
$1,716
$30,614
$133,284
--%
$163,898
2017
$1,653
$30,014
$130,671
--%
$160,685
2016
$1,631
$29,425
$128,109
--%
$157,534
2014
$1,569
$28,415
$123,713
--%
$152,128
2013
$1,579
$28,287
$123,154
--%
$151,441
2012
$1,492
$27,732
$120,739
--%
$148,471

Average Home Price in 91764
Nearby Properties
Zip Code
Price
Bed
Bath
Sqft
Lot
Sold Date
$662,536
$662,536
4 Beds
3 Baths
1,948 Sqft
7,200 Lot (sqft)
Sold 10/20/2026
$594,551
$594,551
3 Beds
2 Baths
1,489 Sqft
7,700 Lot (sqft)
Sold 09/10/2026
$839,295
$839,295
4 Beds
3 Baths
1,986 Sqft
10,880 Lot (sqft)
Sold 09/03/2026
$799,999
$799,999
4 Beds
2 Baths
1,728 Sqft
7,800 Lot (sqft)
Sold 08/19/2026
$494,747
3 Beds
2.5 Baths
1,609 Sqft
1,609 Lot (sqft)
Sold 08/14/2026
$728,990
4 Beds
2.5 Baths
1,734 Sqft
7,245 Lot (sqft)
Sold 10/26/2026
$519,890
3 Beds
2.5 Baths
1,609 Sqft
1,609 Lot (sqft)
Sold 10/13/2026
$665,083
$665,083
3 Beds
2 Baths
1,630 Sqft
13,230 Lot (sqft)
Sold 10/27/2026
$799,754
$799,754
3 Beds
2 Baths
1,728 Sqft
7,140 Lot (sqft)
Sold 10/26/2026
Calculators
Mortgage
Mortgage Calculator
Details for 2043 E MULBERRY CT
Property Debt
Foreclosure Contact Details
Similar Homes Nearby


Guides for Mulberry Ct

San Bernardino’s real estate values rose steadily in early to mid-2024, with average property values peaking at $500K in May. Sale prices per sq. ft also increased modestly despite a subtle decrease in number of properties sold. Comparison with nearby cities shows varied market trends.