Member Features
Find Real Estate Bargain!
Full foreclosure details
Home value, equity and ownership info
Find homes priced below market
Get full access with a FREE Account
Already a member?
$250,000
Listing Price3beds
2baths
1,320sqft
734sqft lot
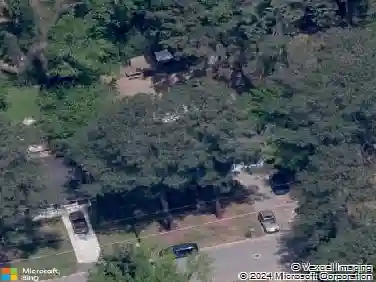
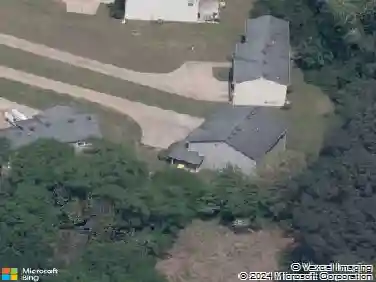
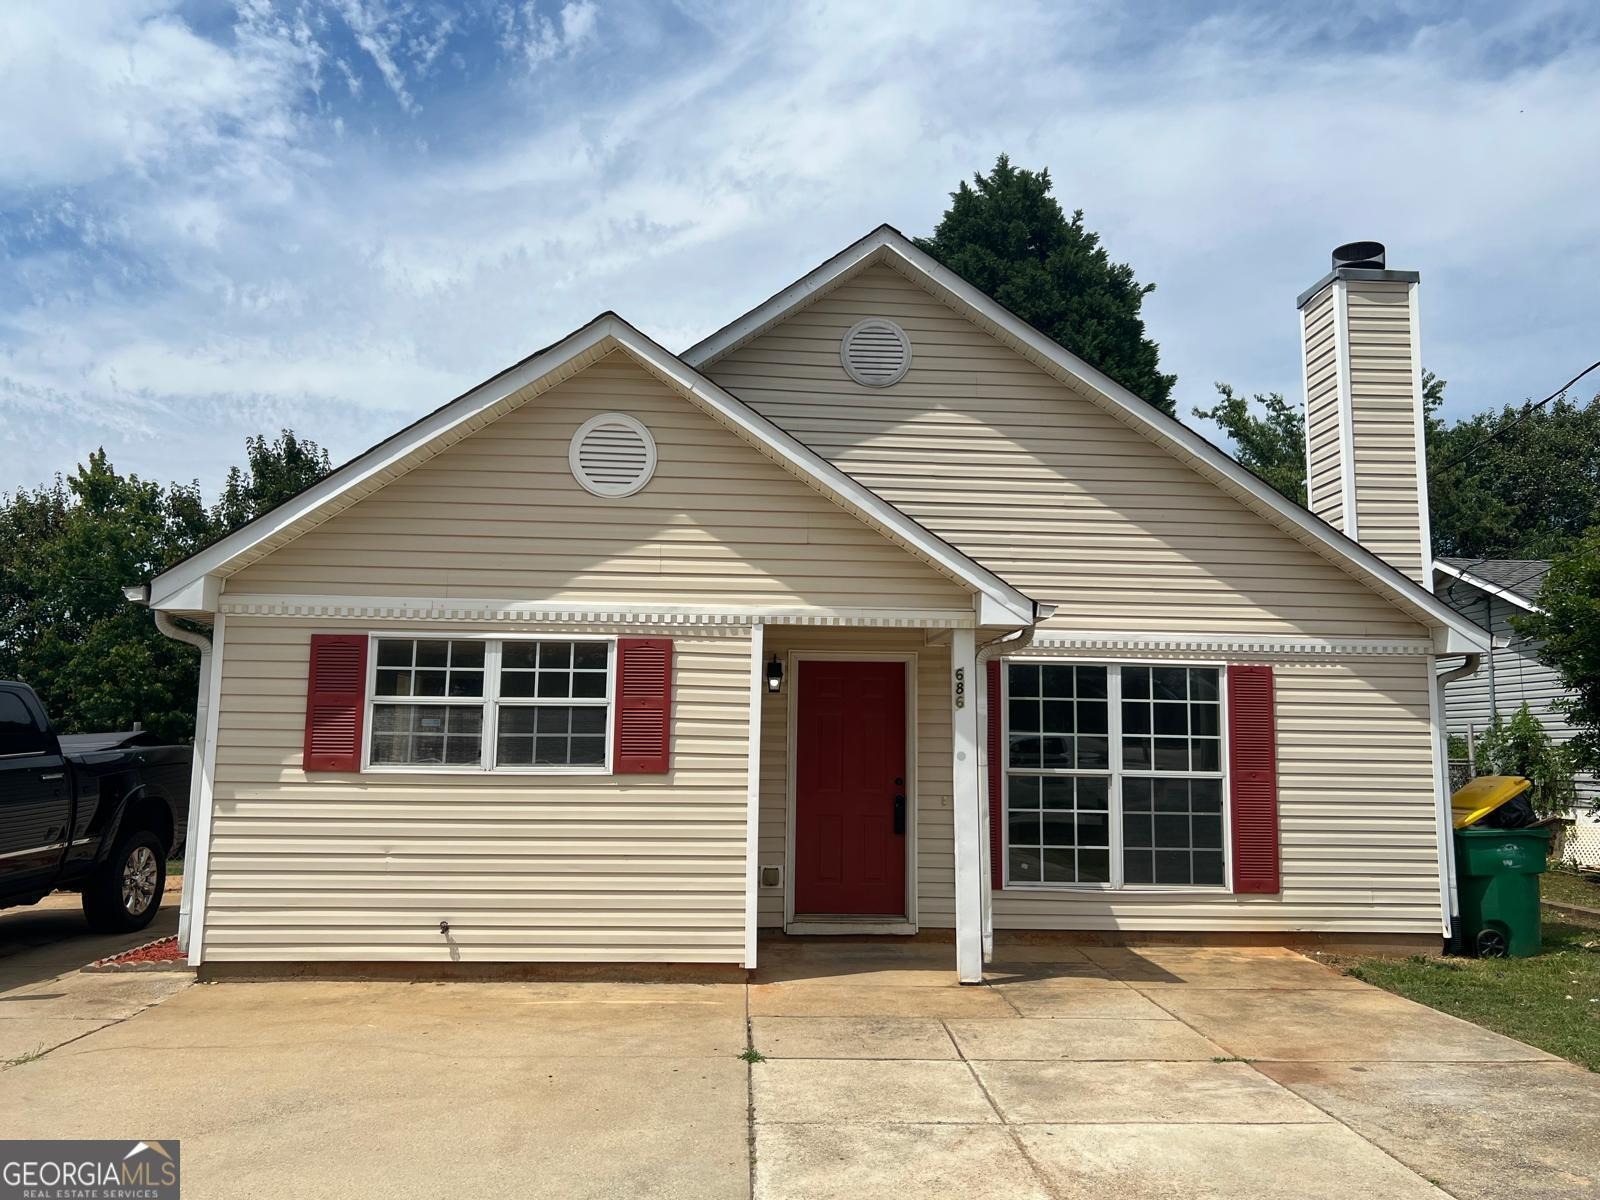
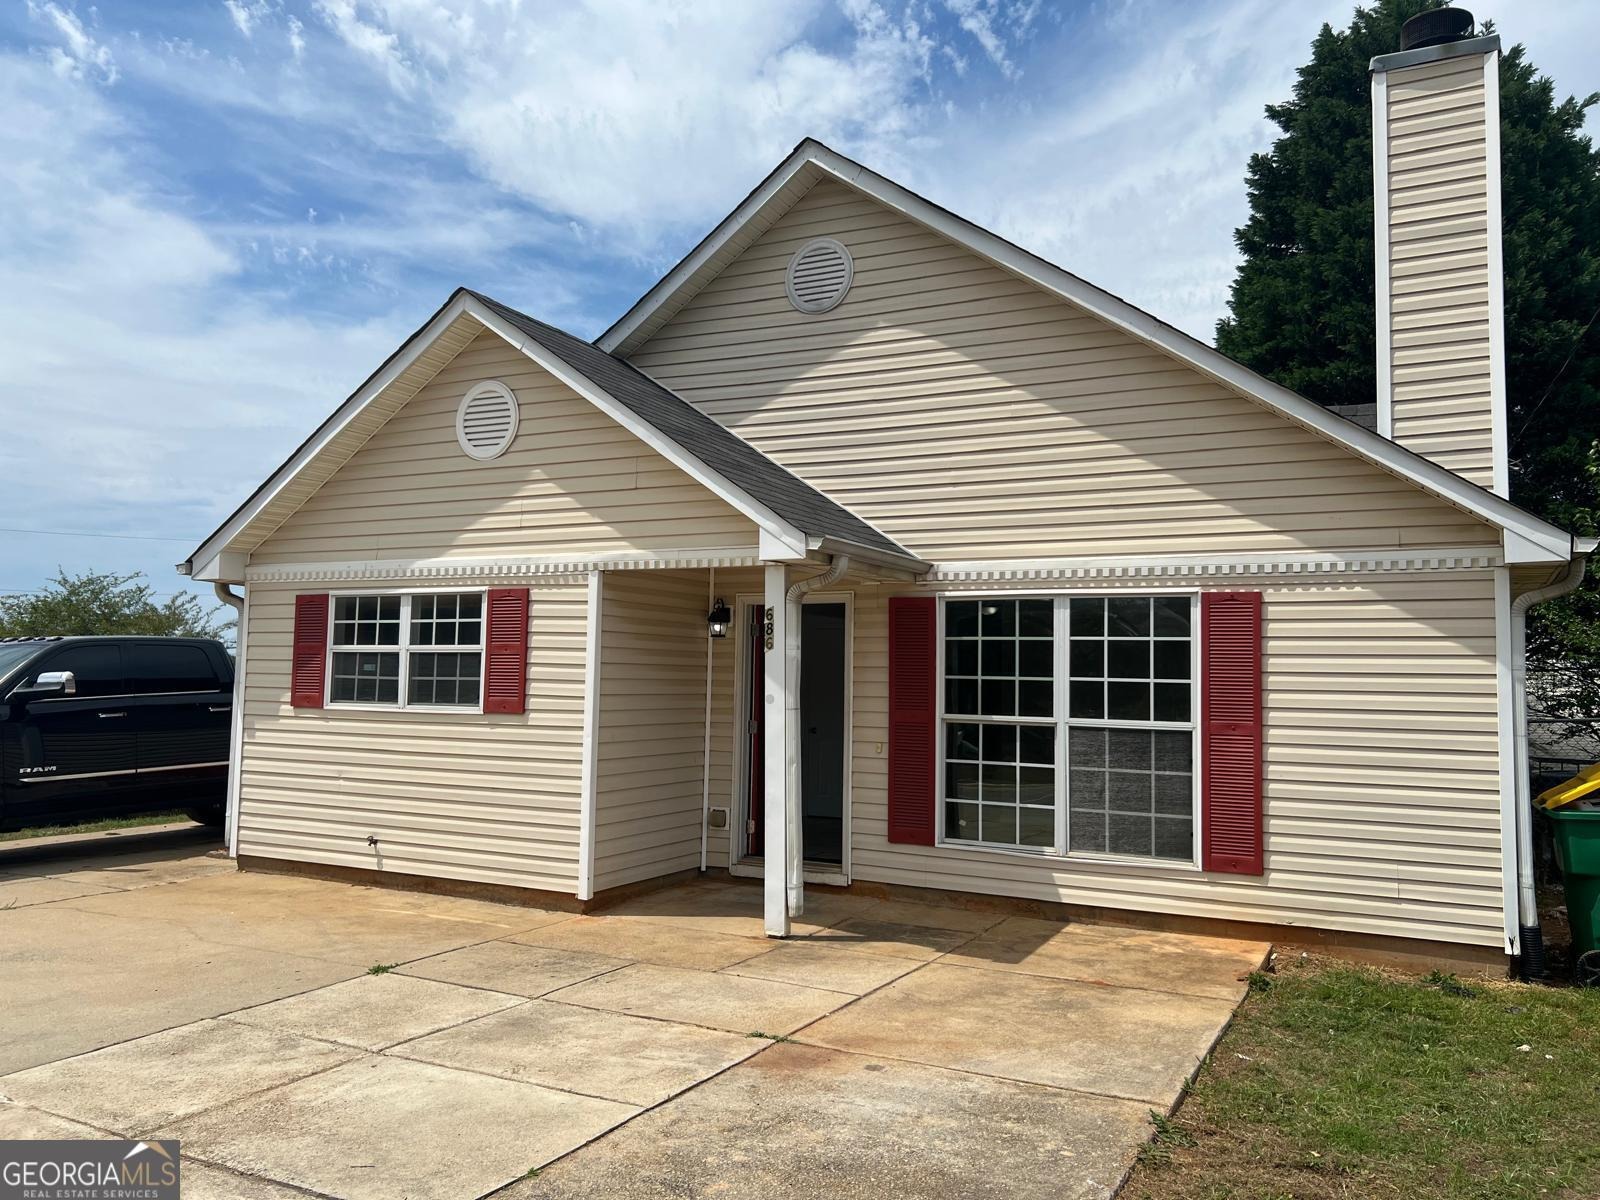
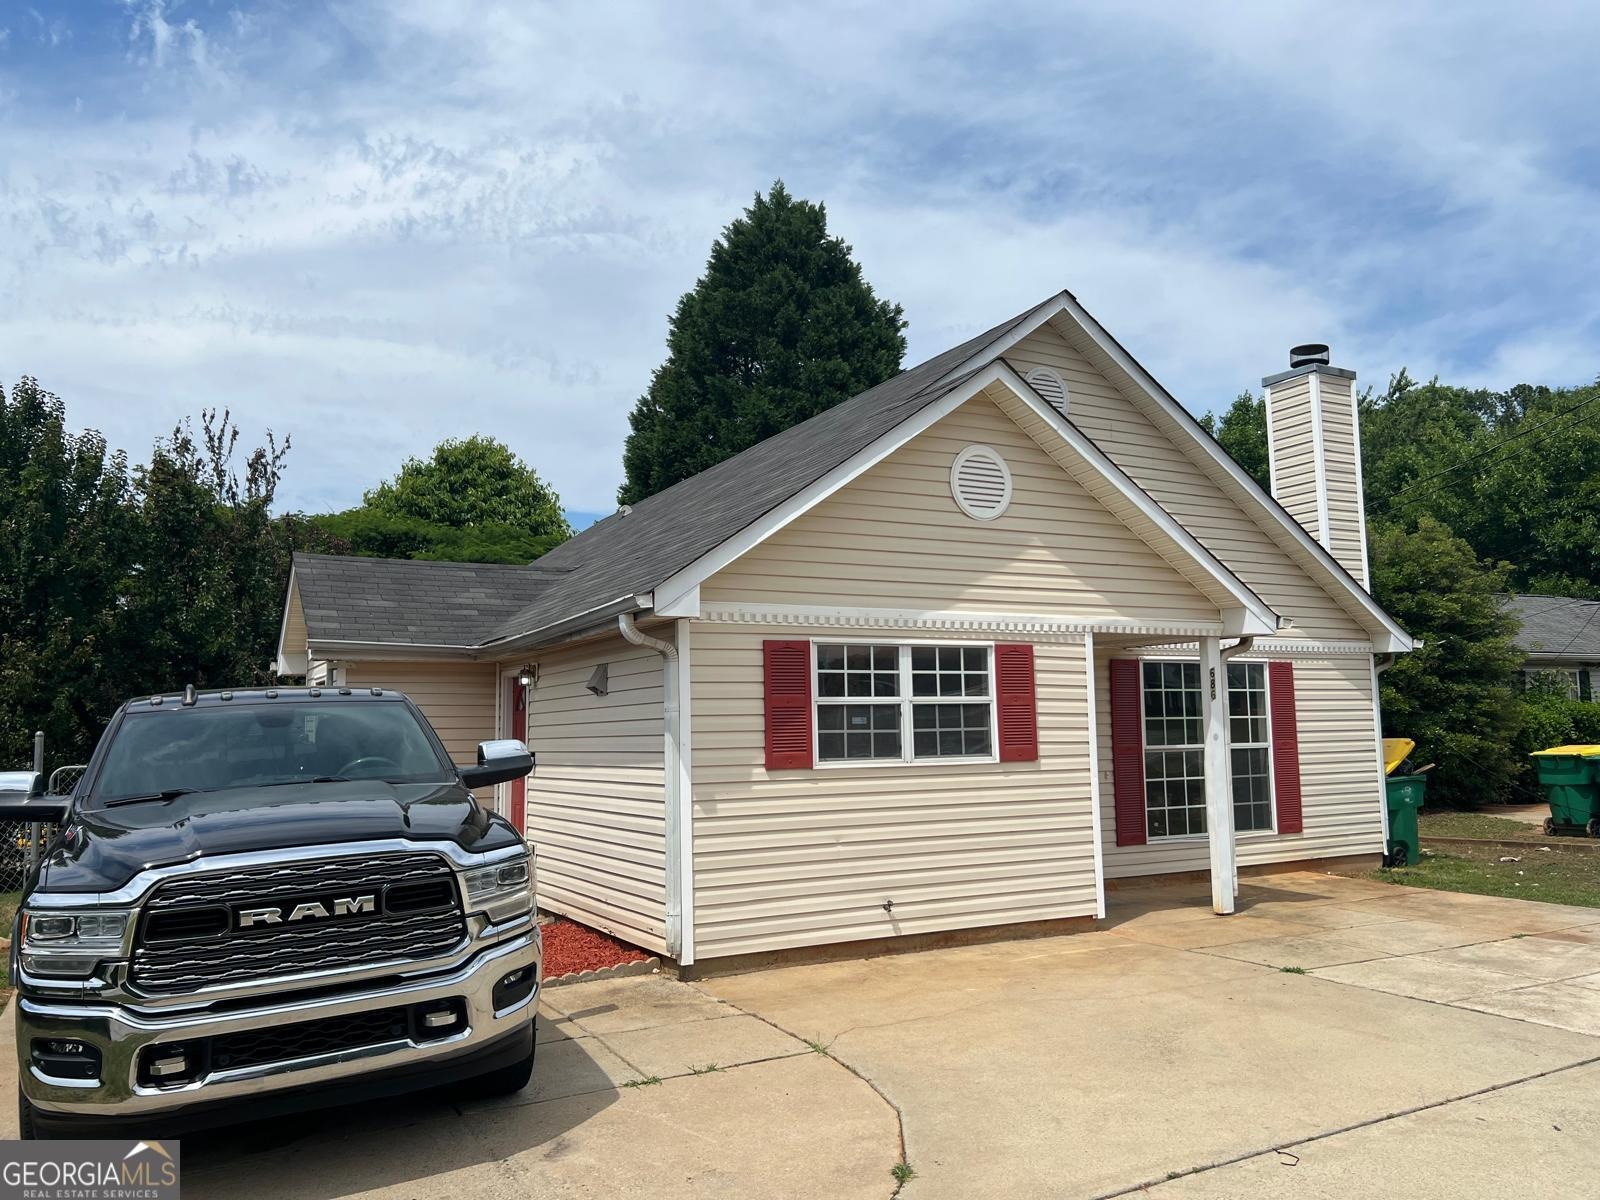
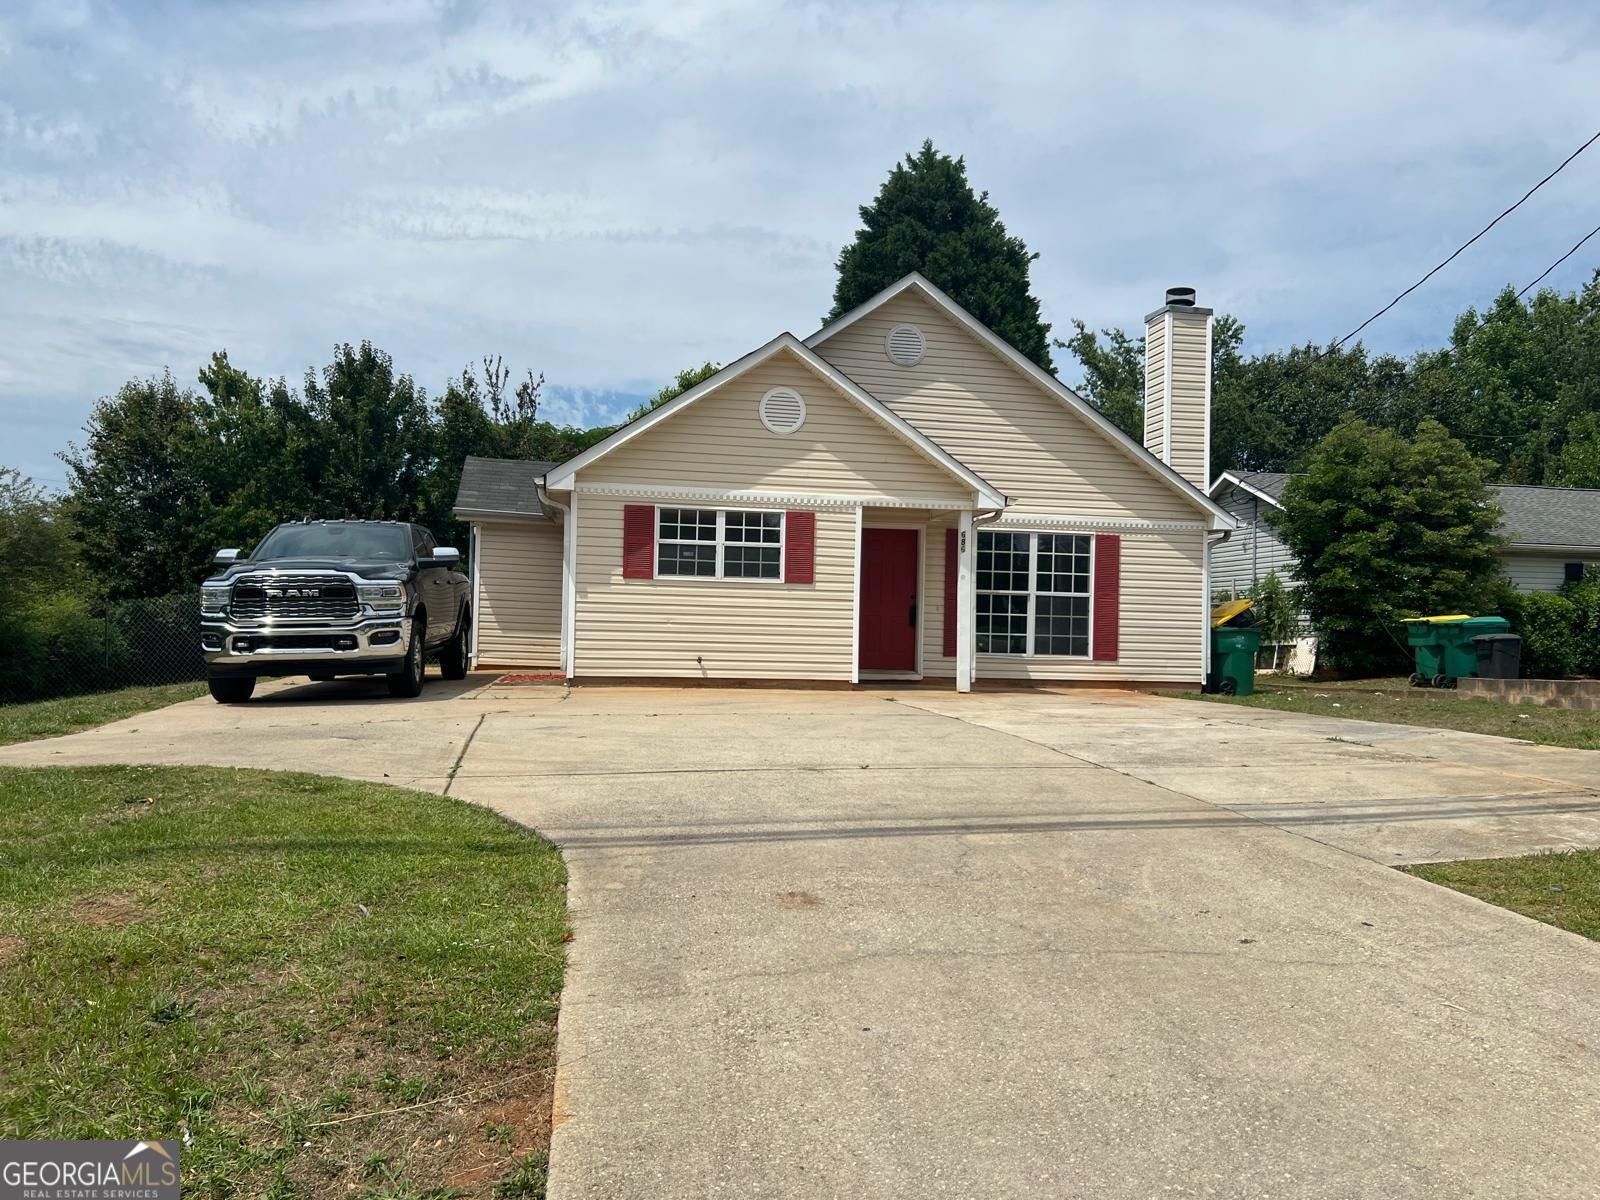
686 Morrow Rd, Forest Park, GA 30297
Member Features
Find Real Estate Bargain!
Full foreclosure details
Home value, equity and ownership info
Find homes priced below market
Get full access with a FREE Account
Already a member?
For Sale
Off Market
Home type
Price / sqft
Year built
Home Details
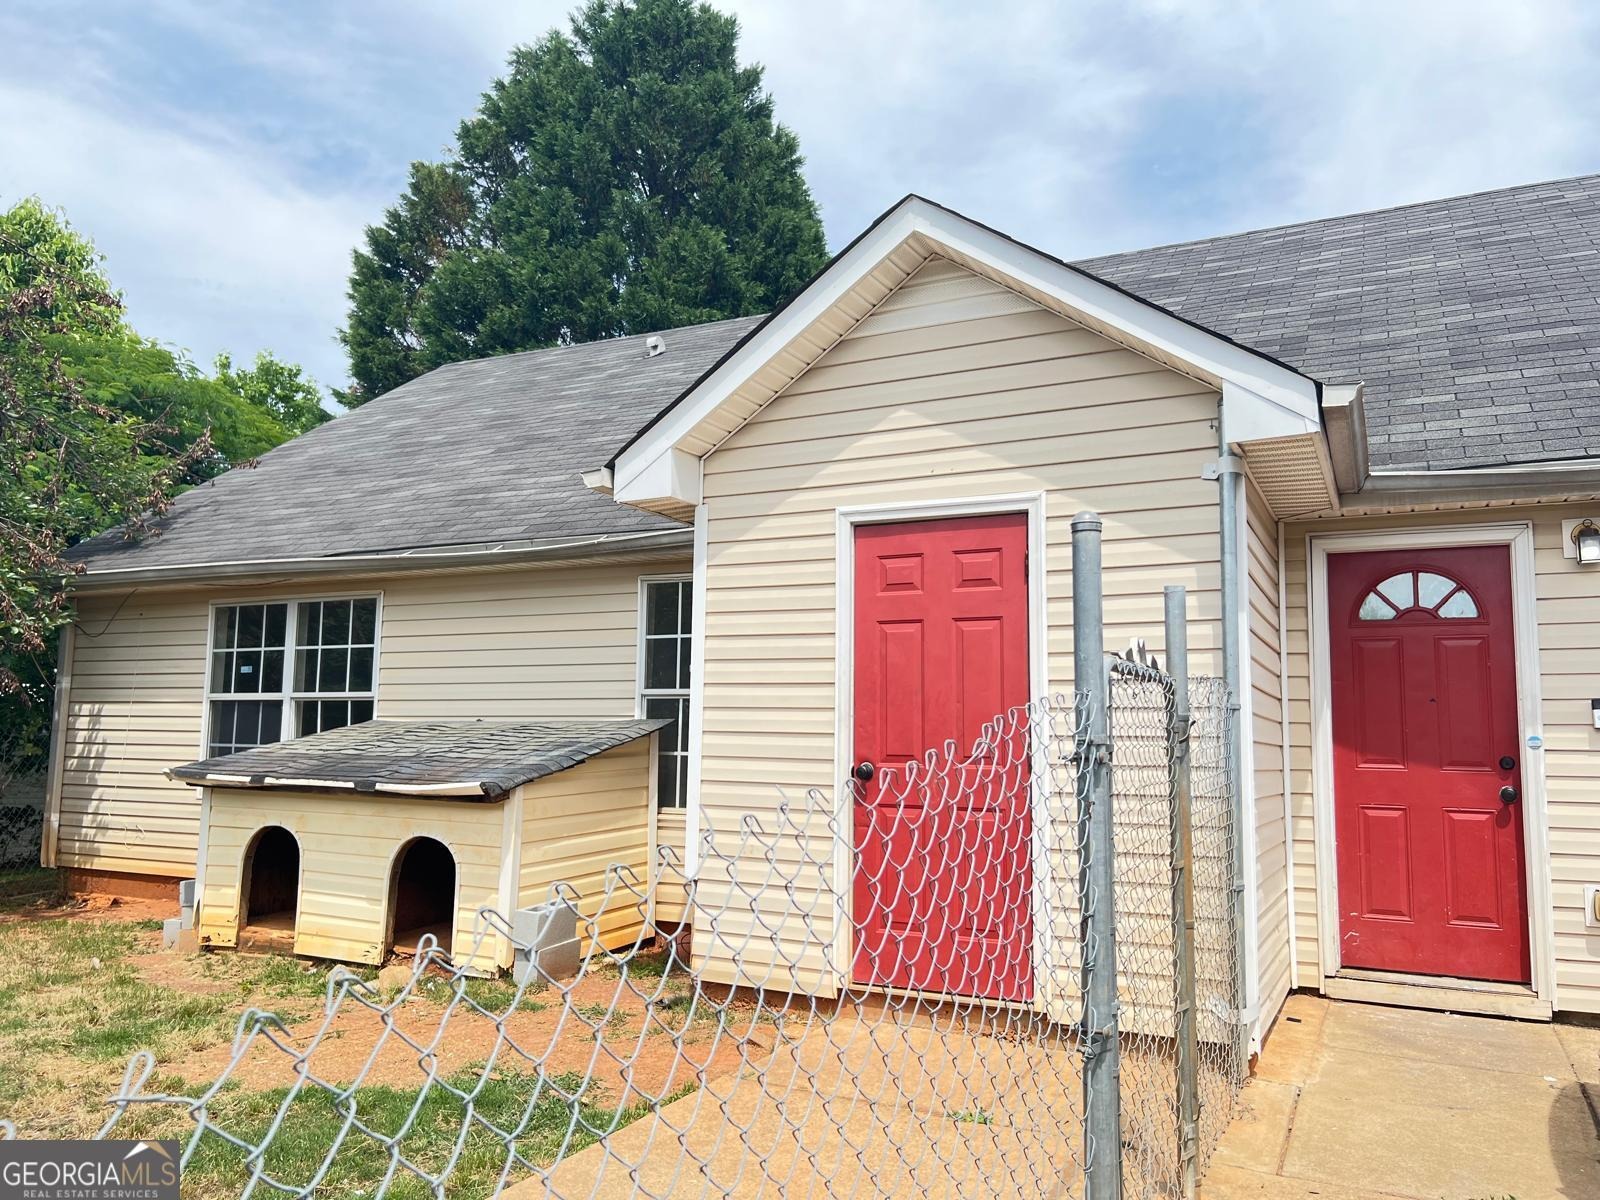
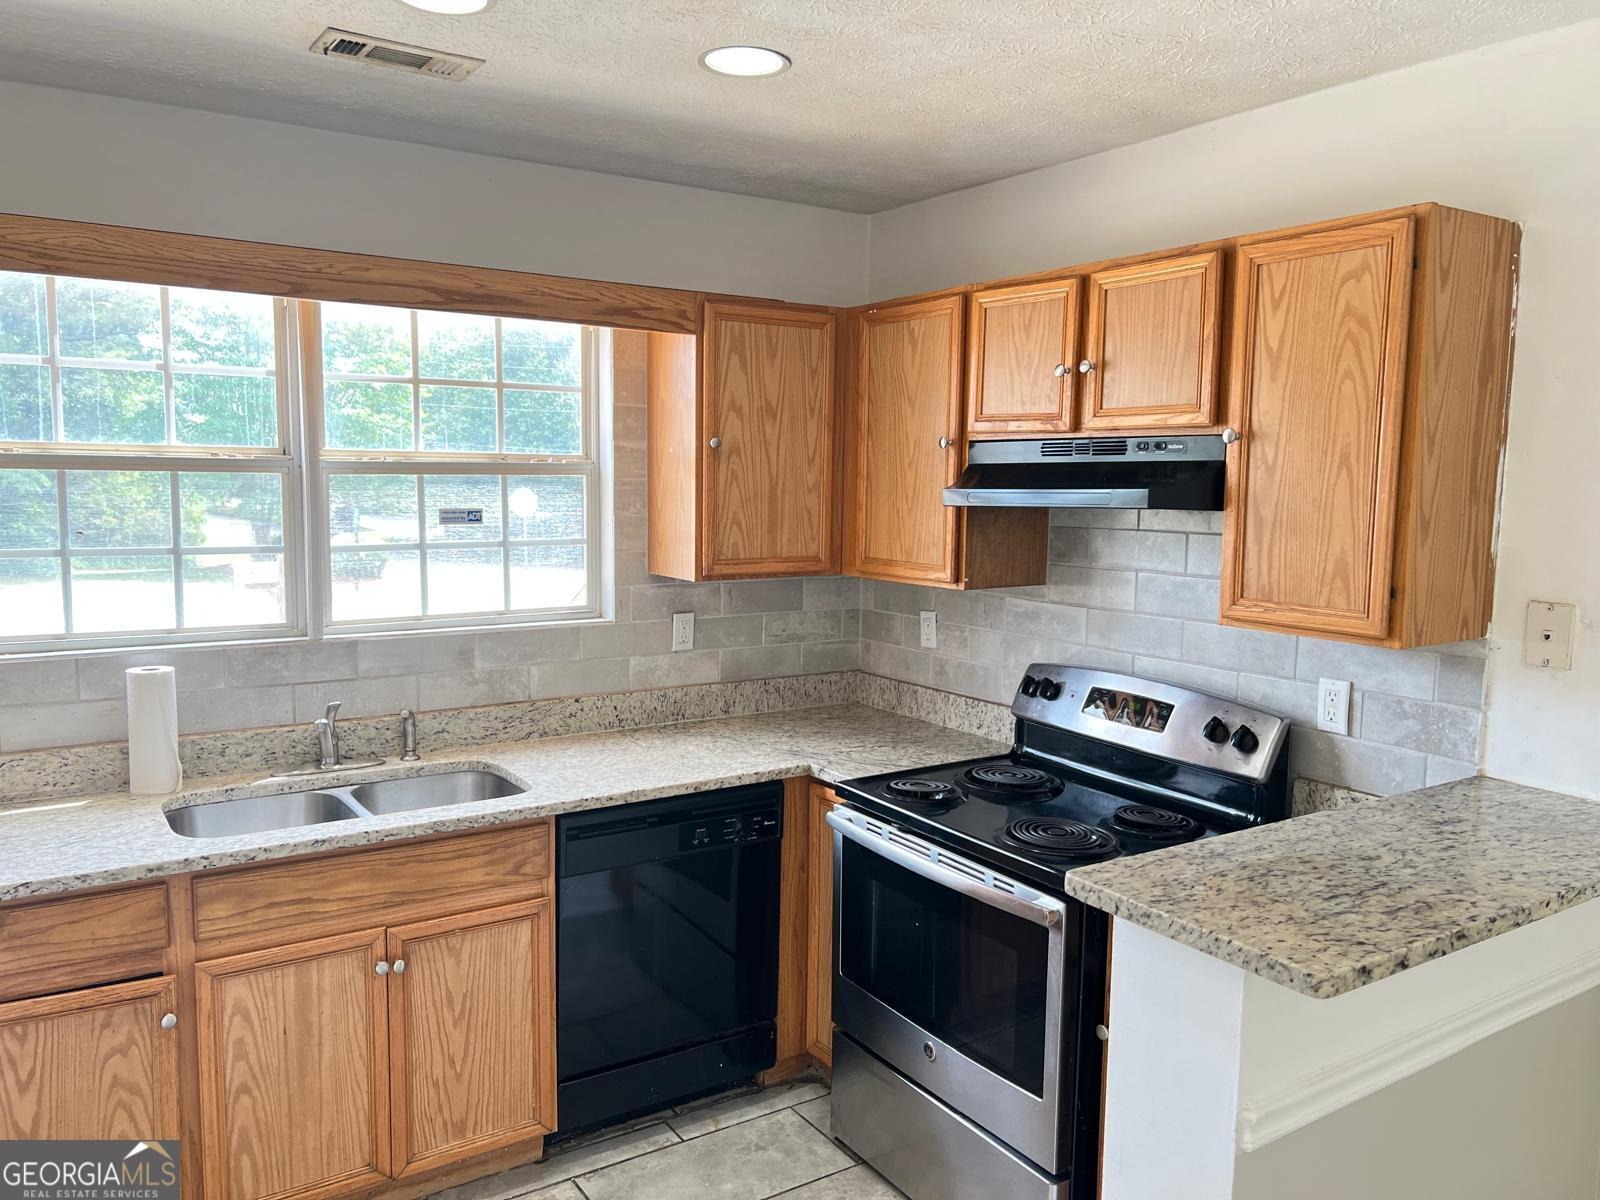
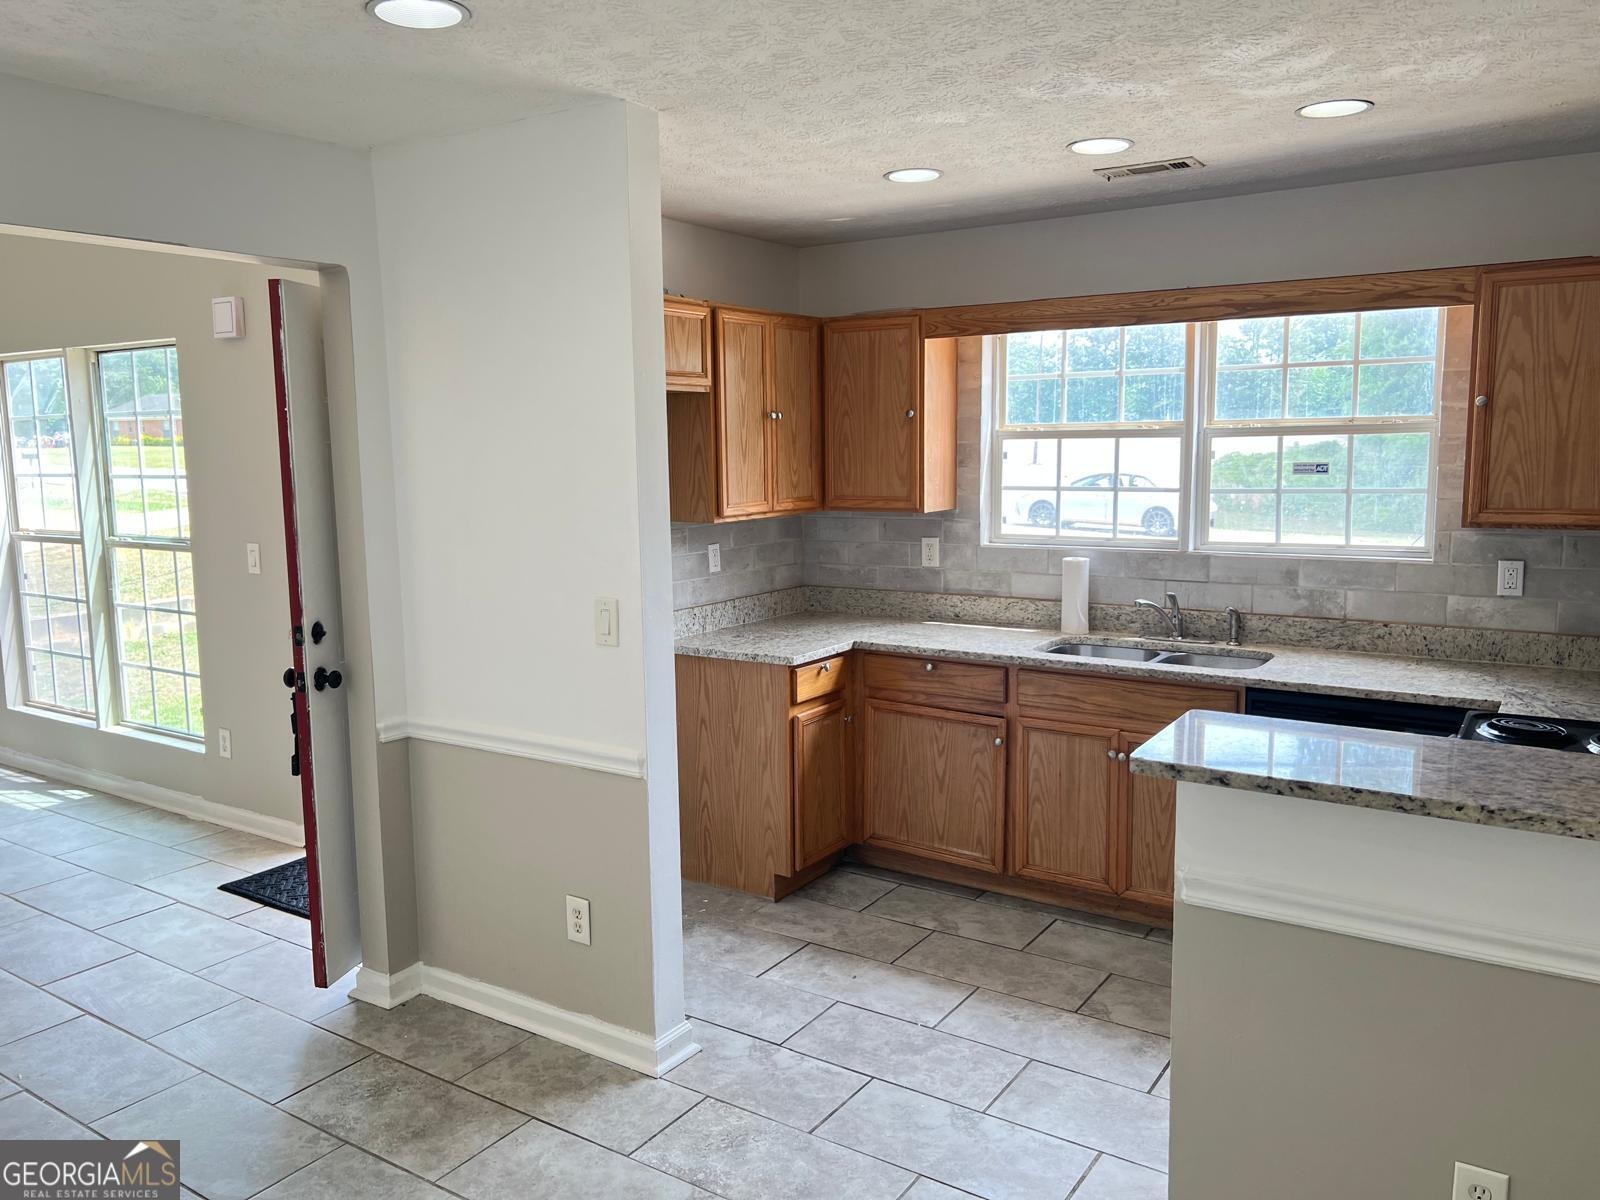
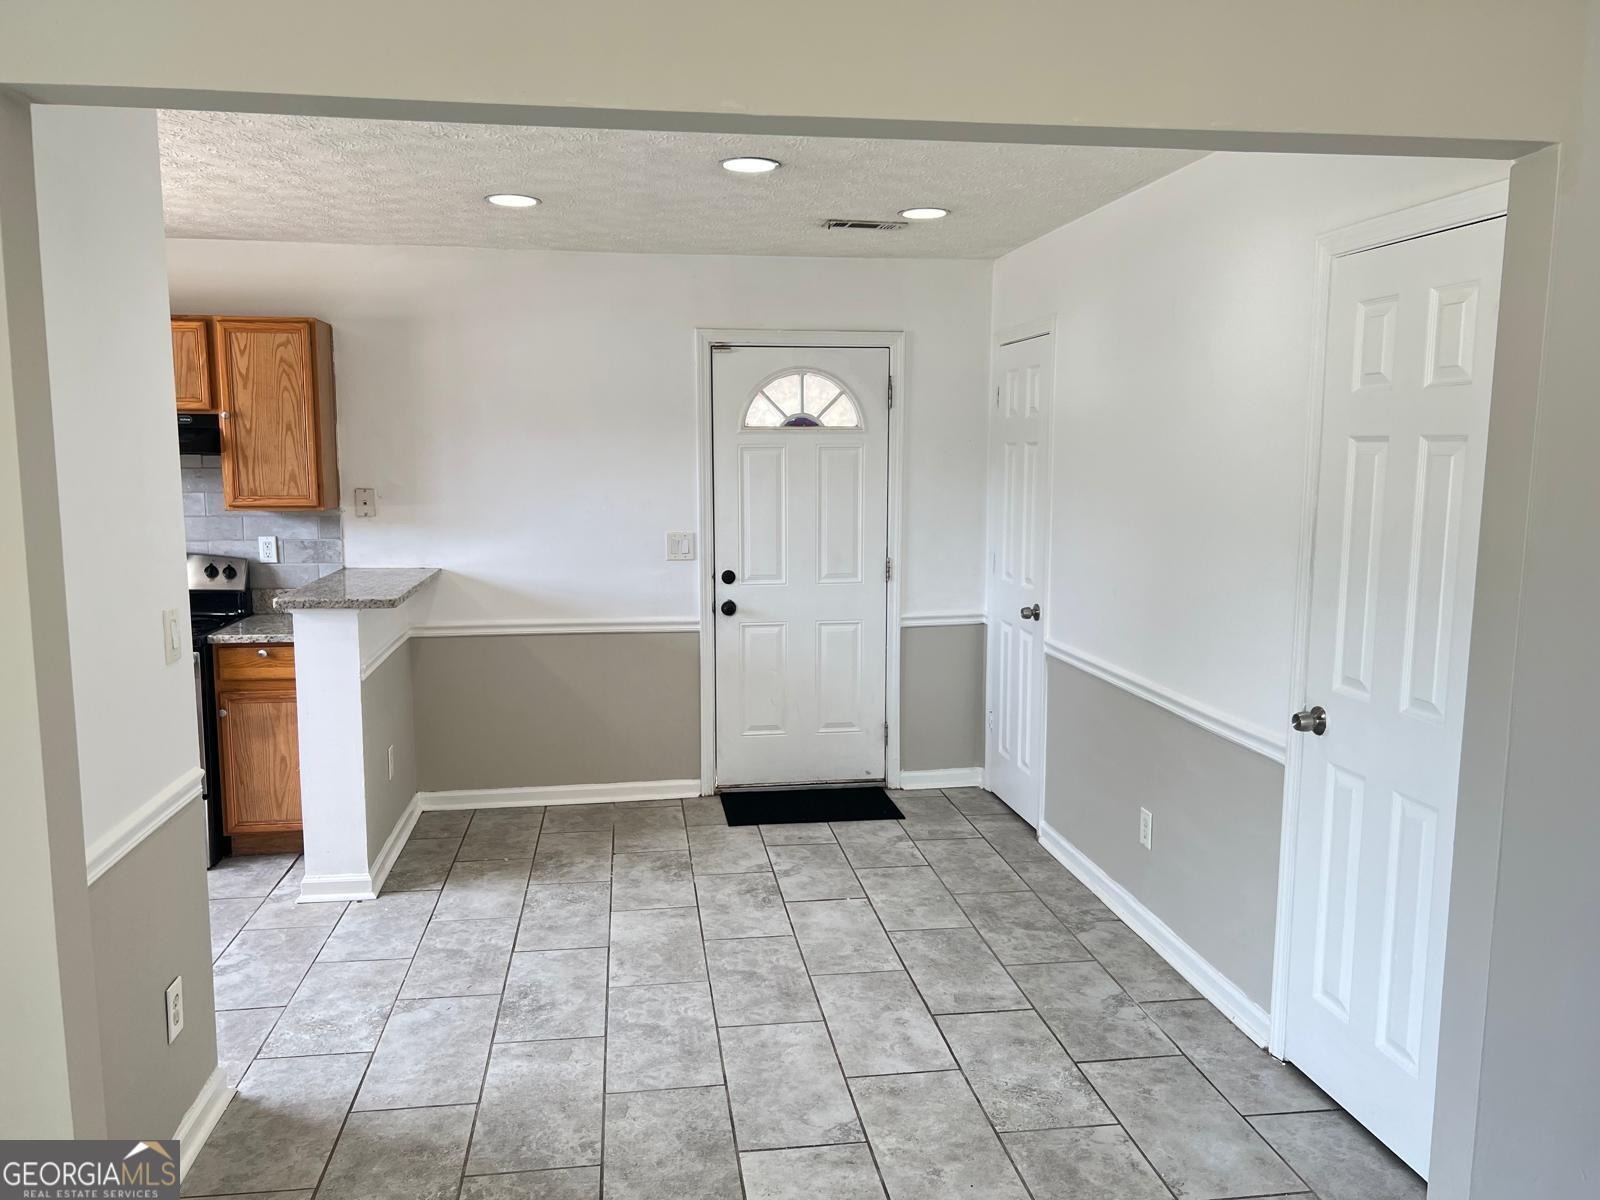
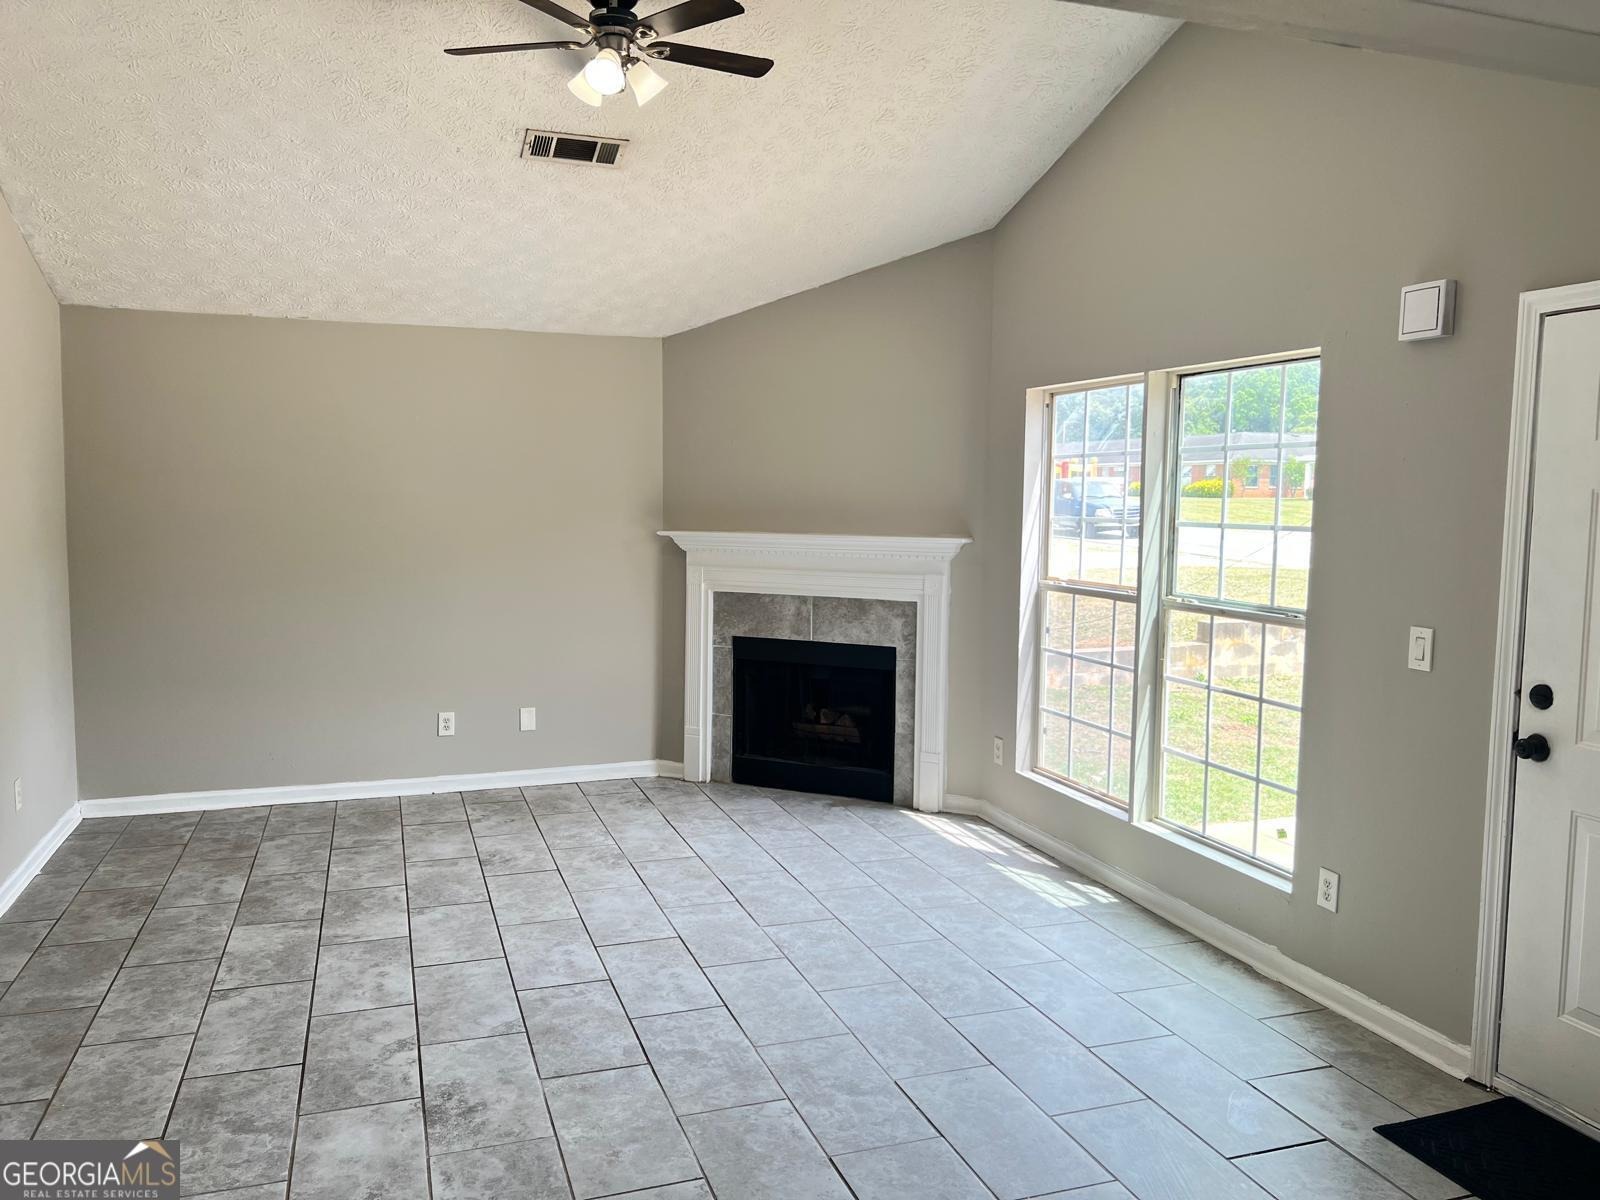
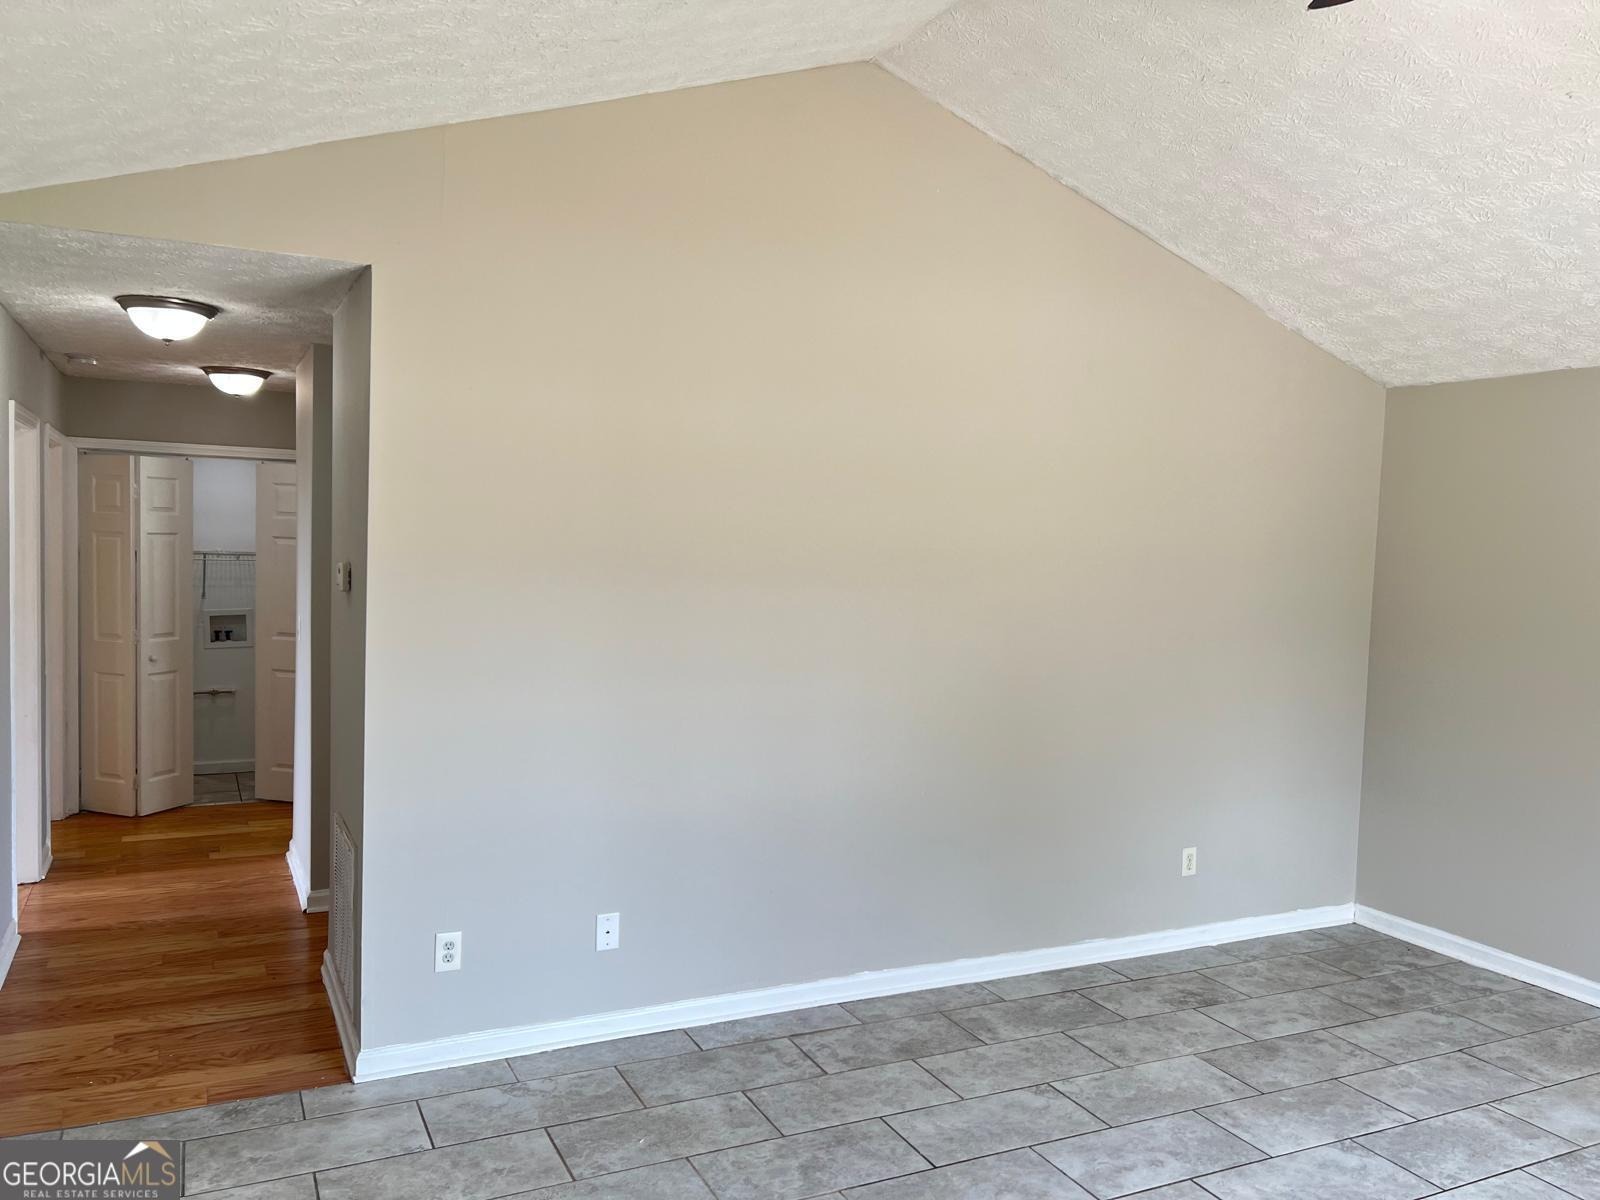
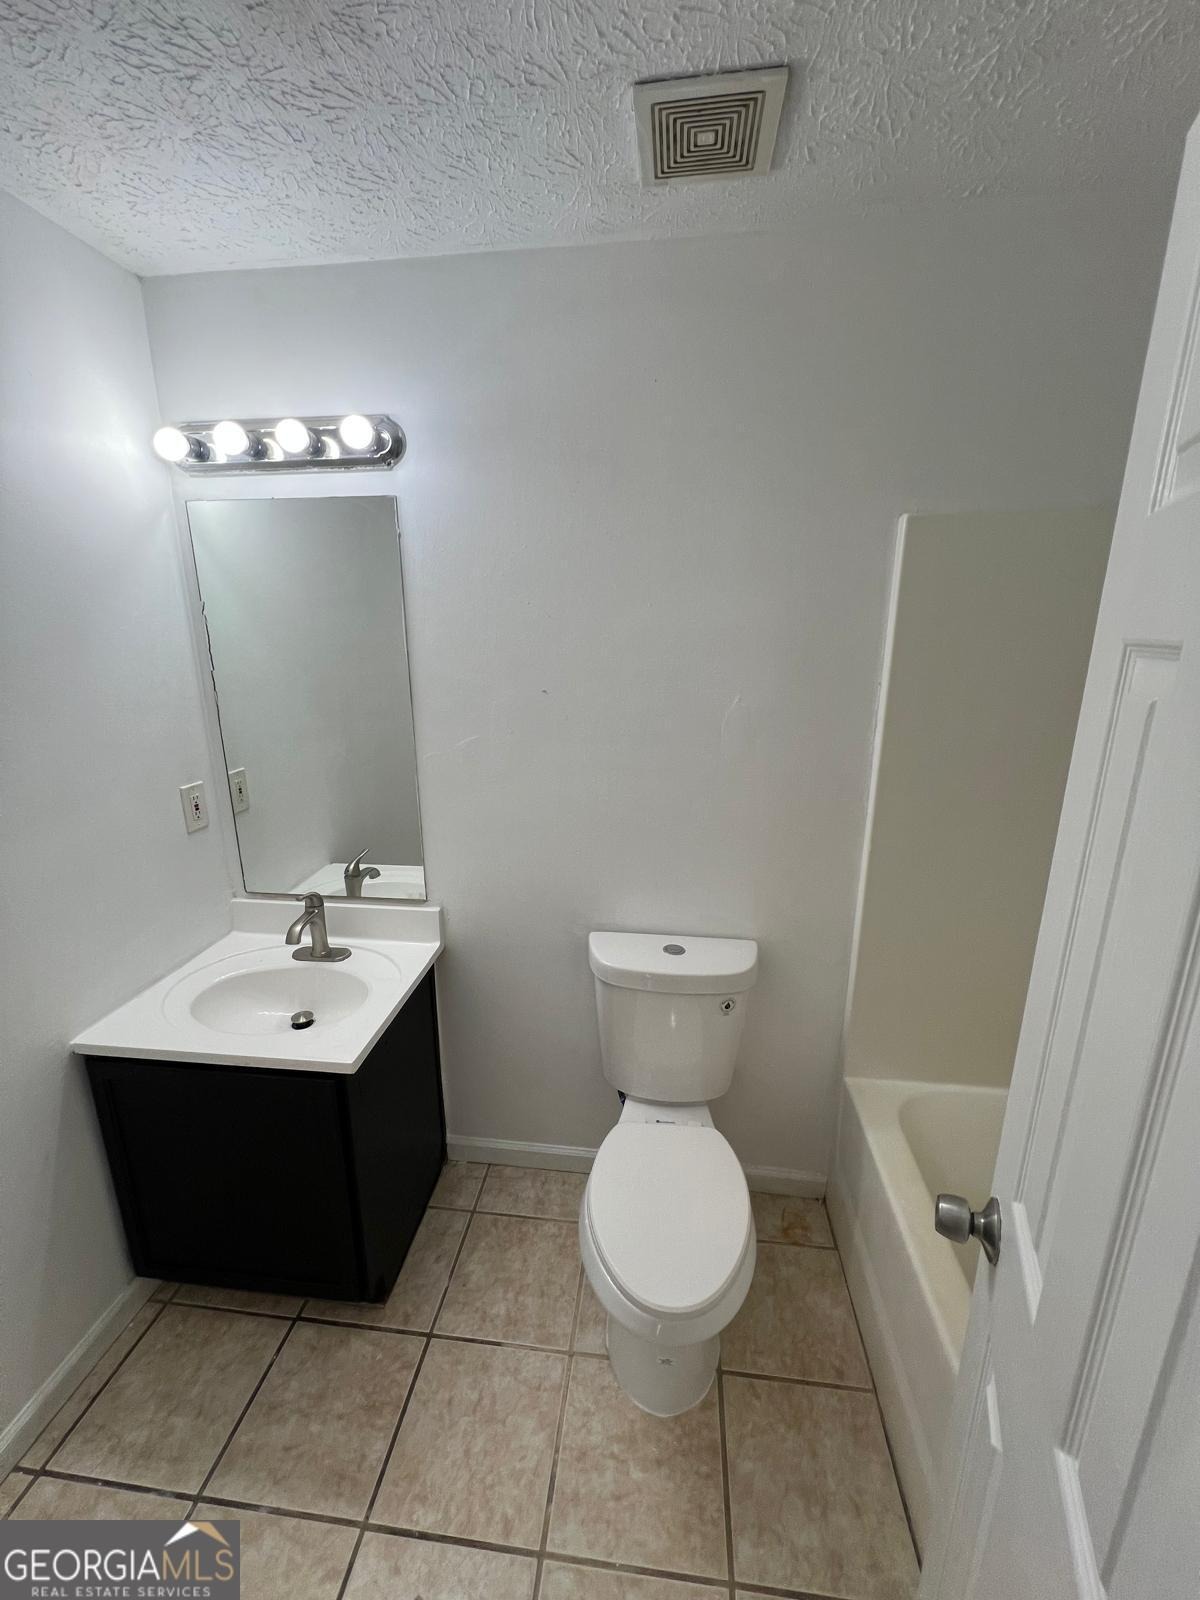
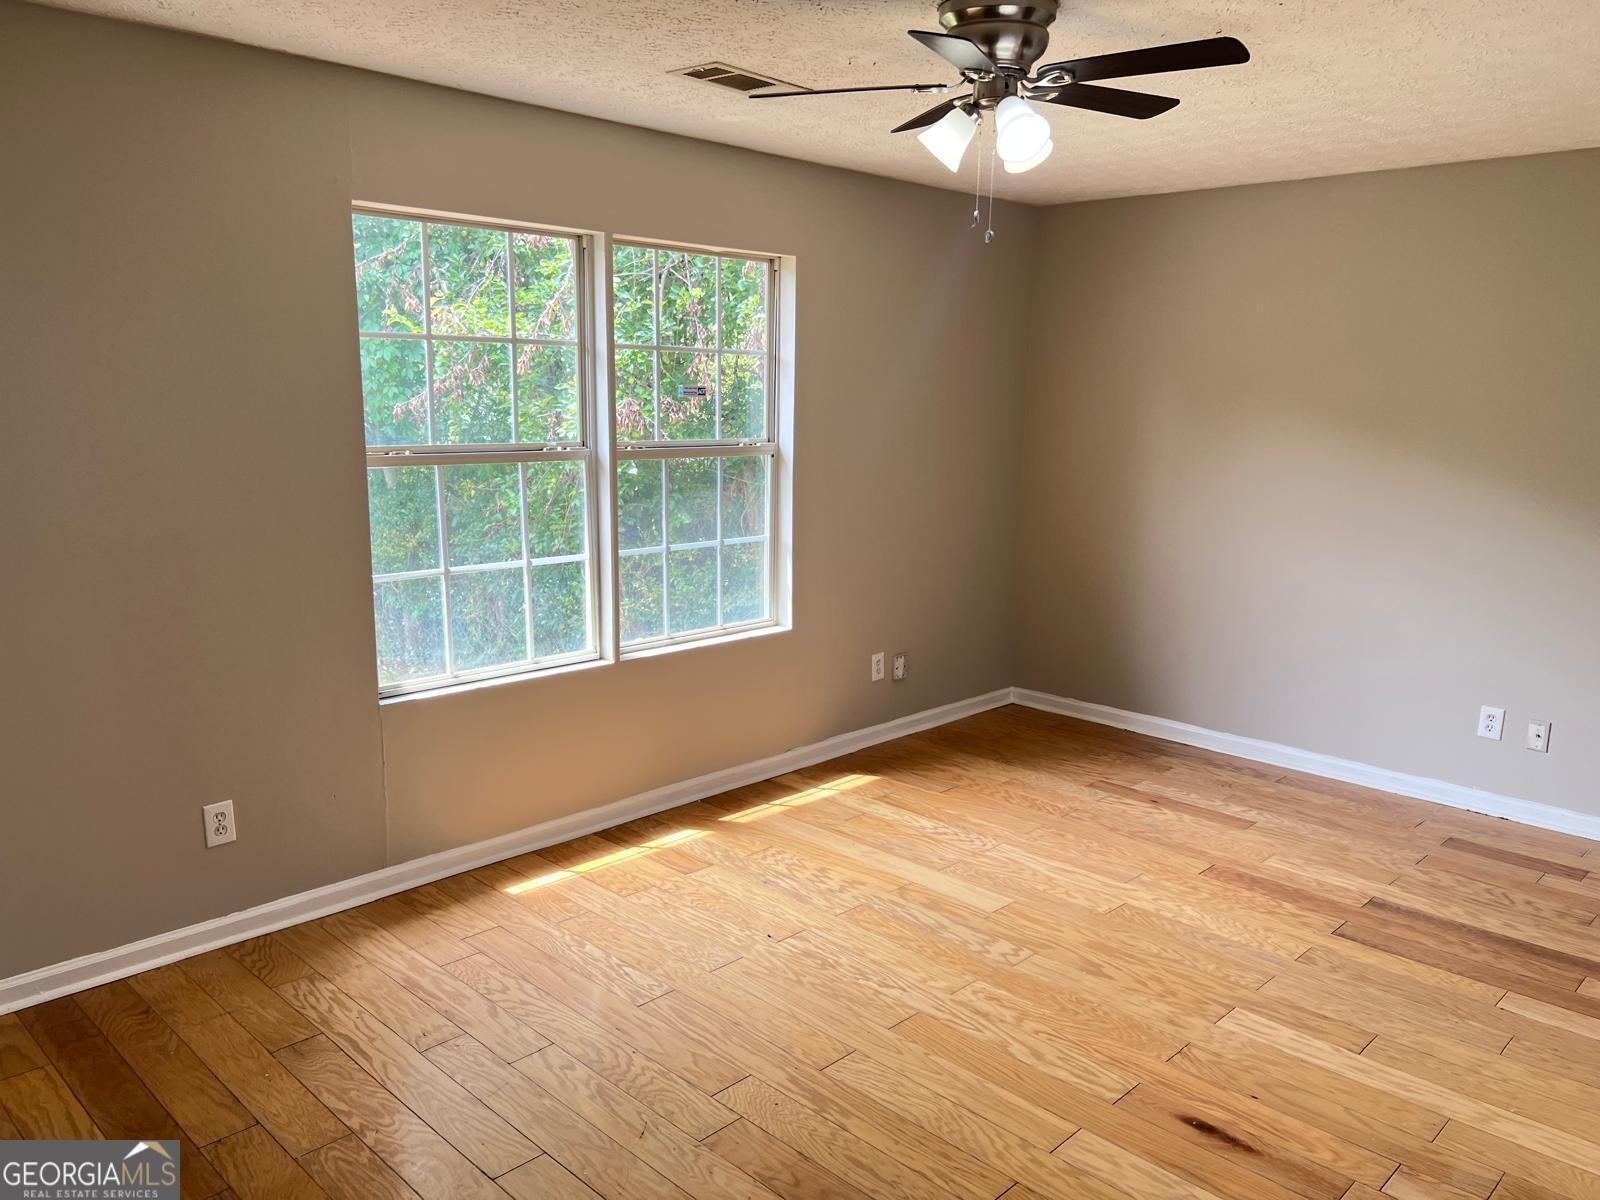
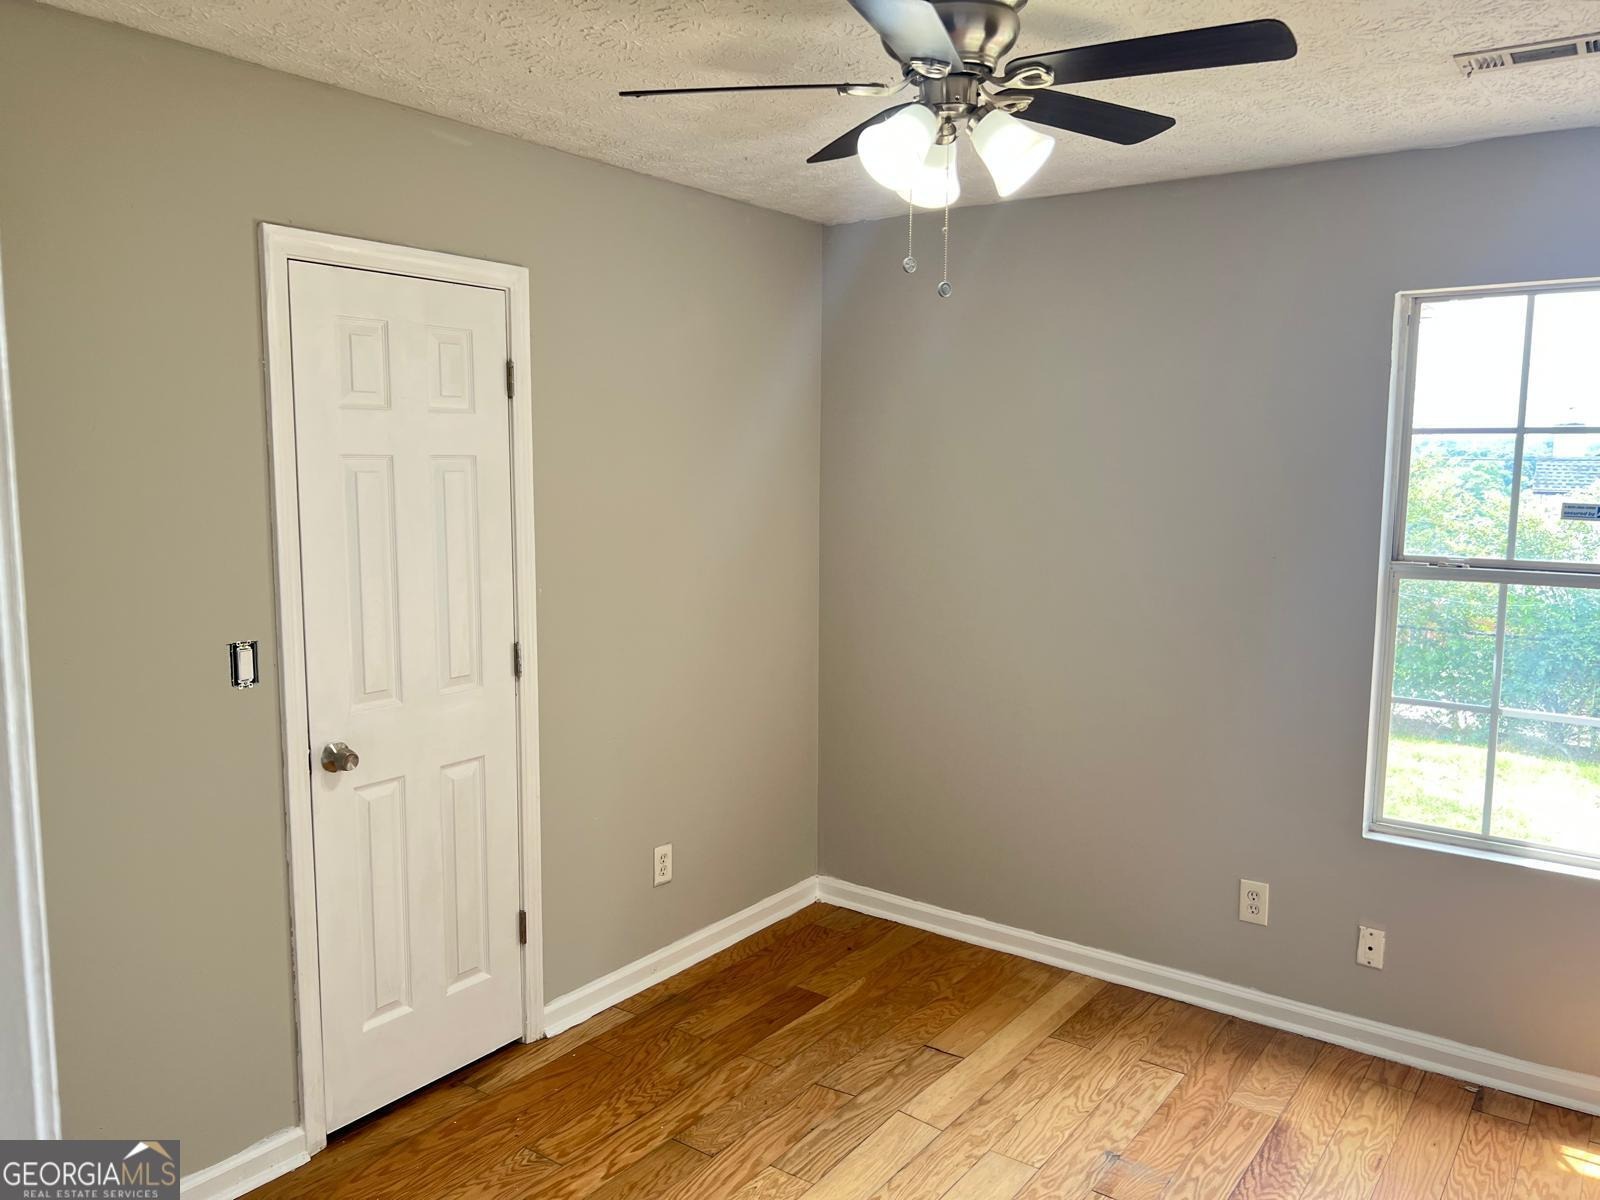
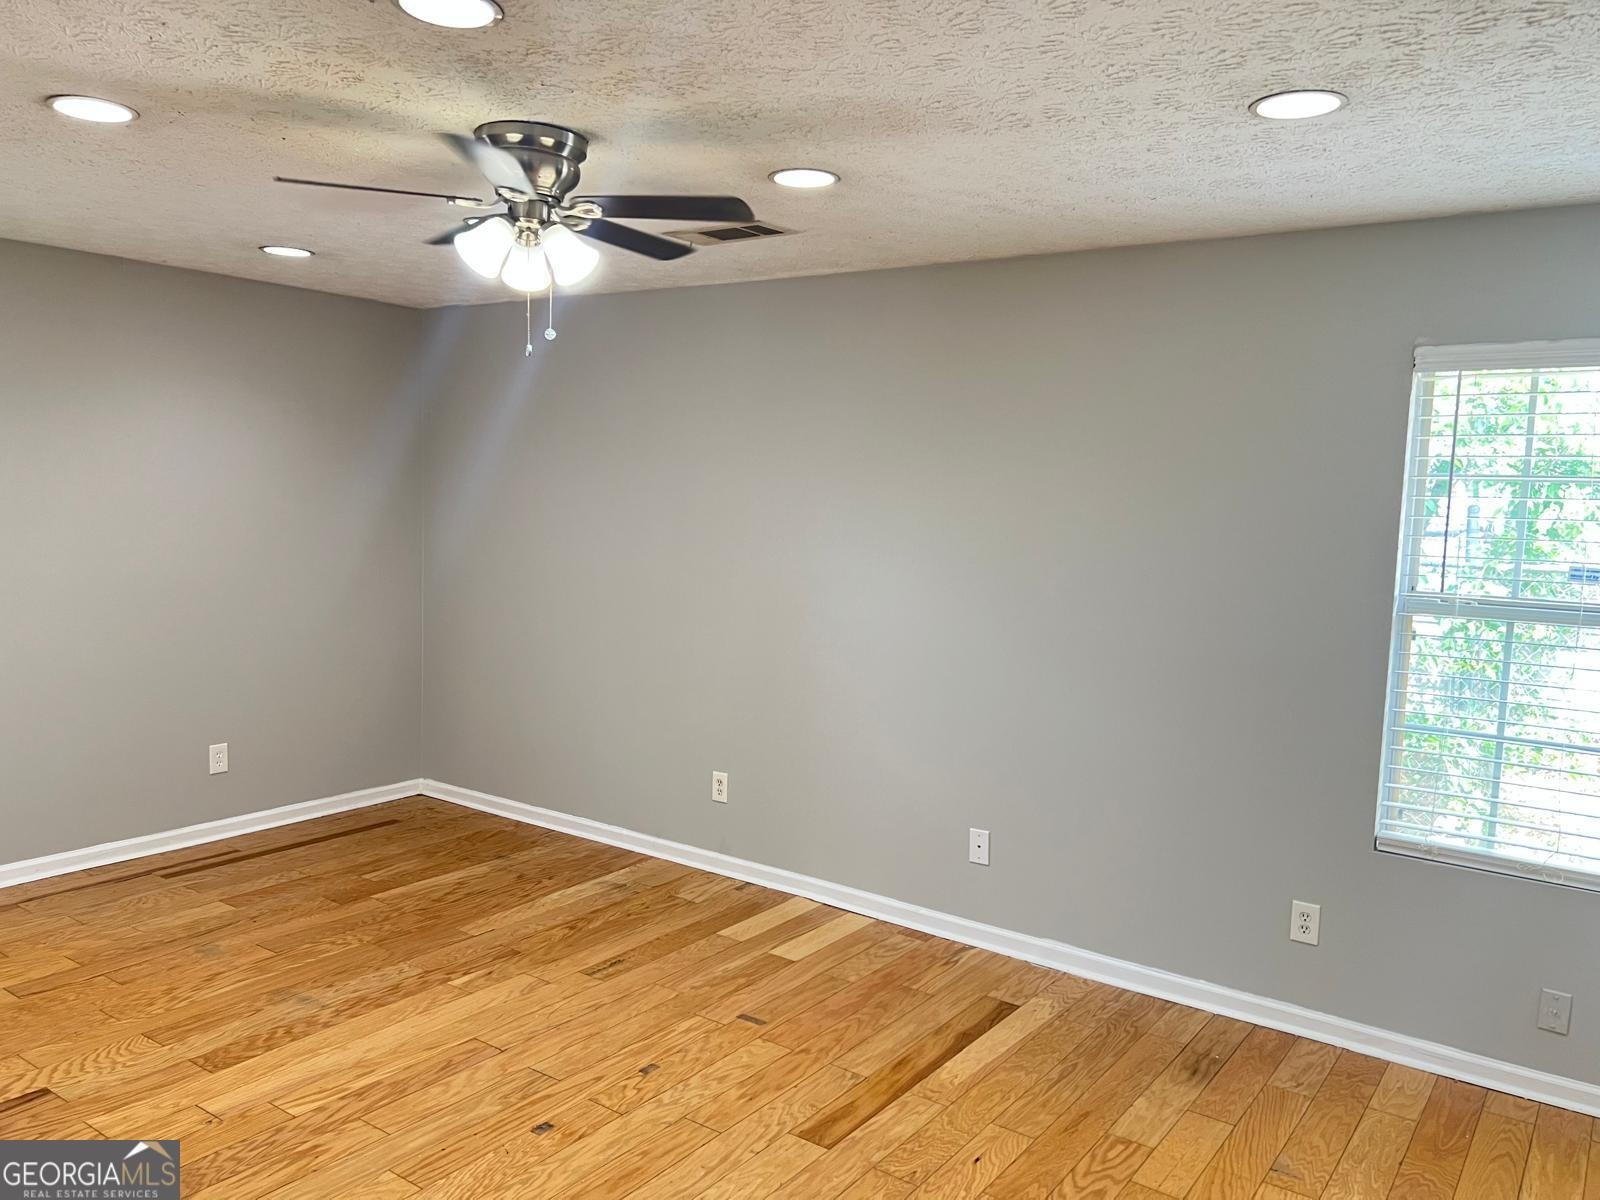
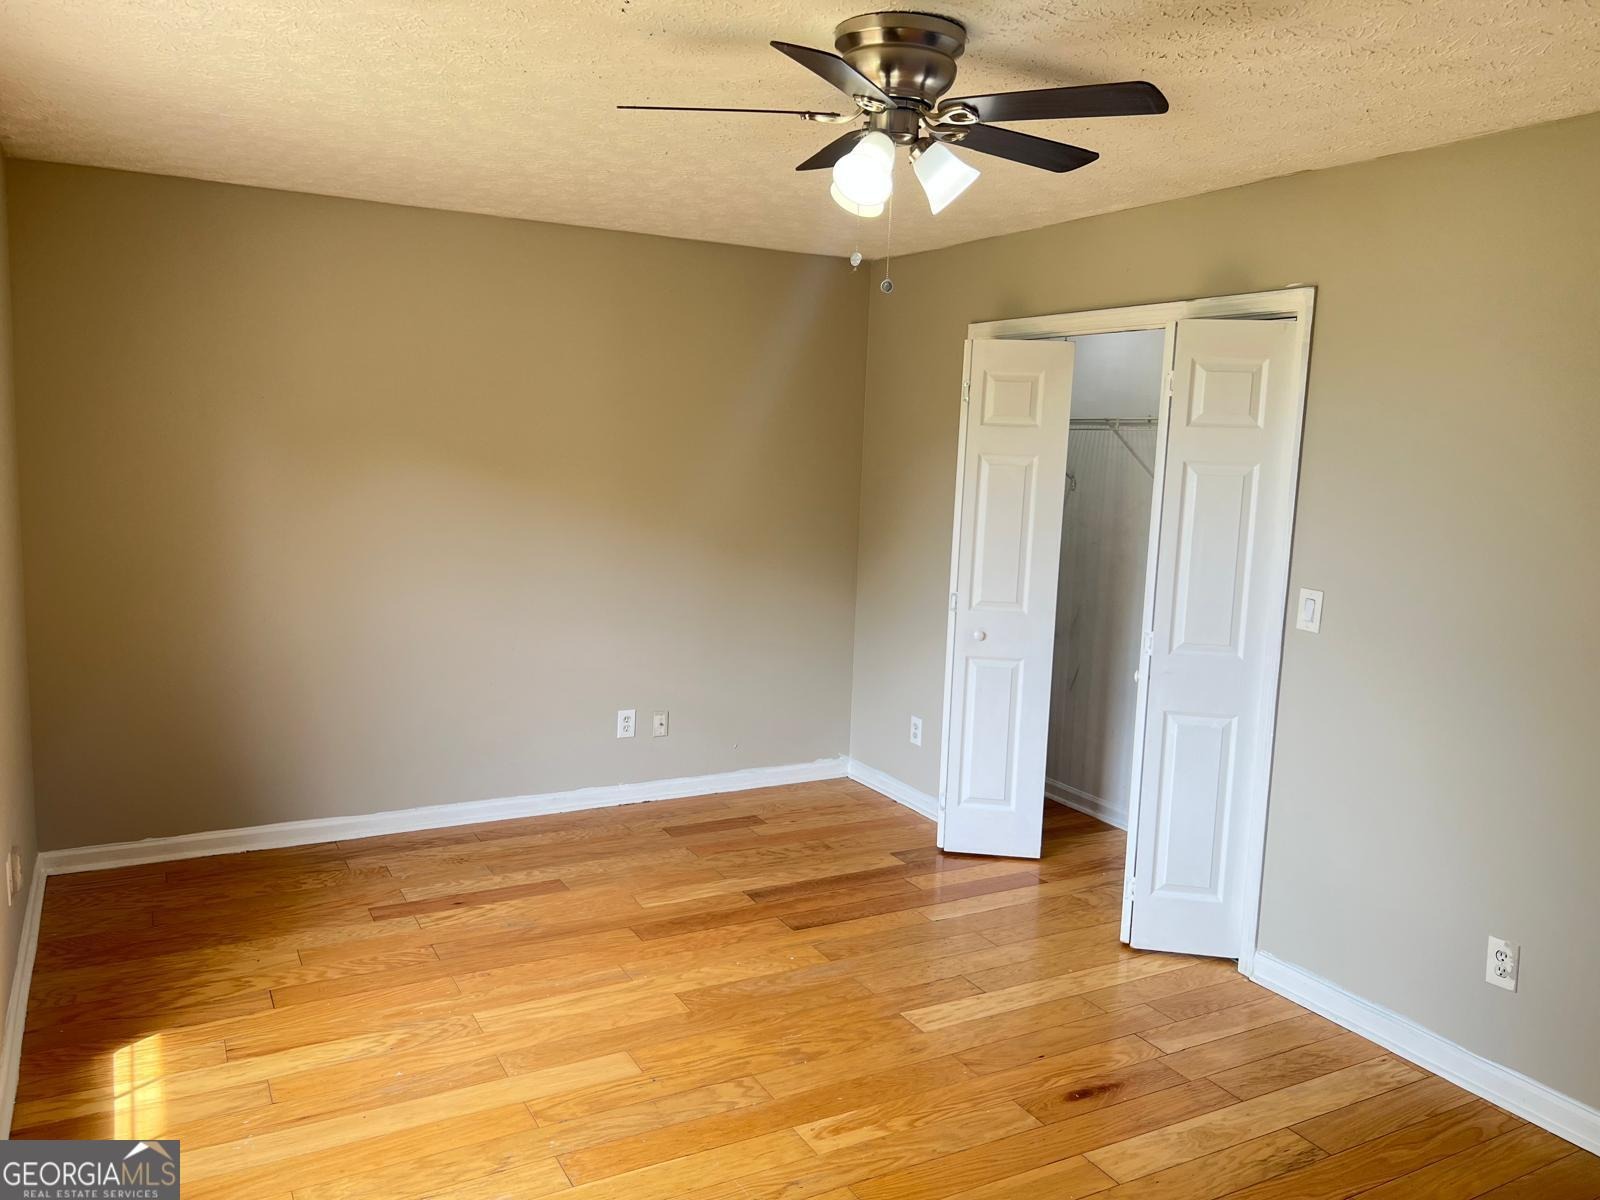
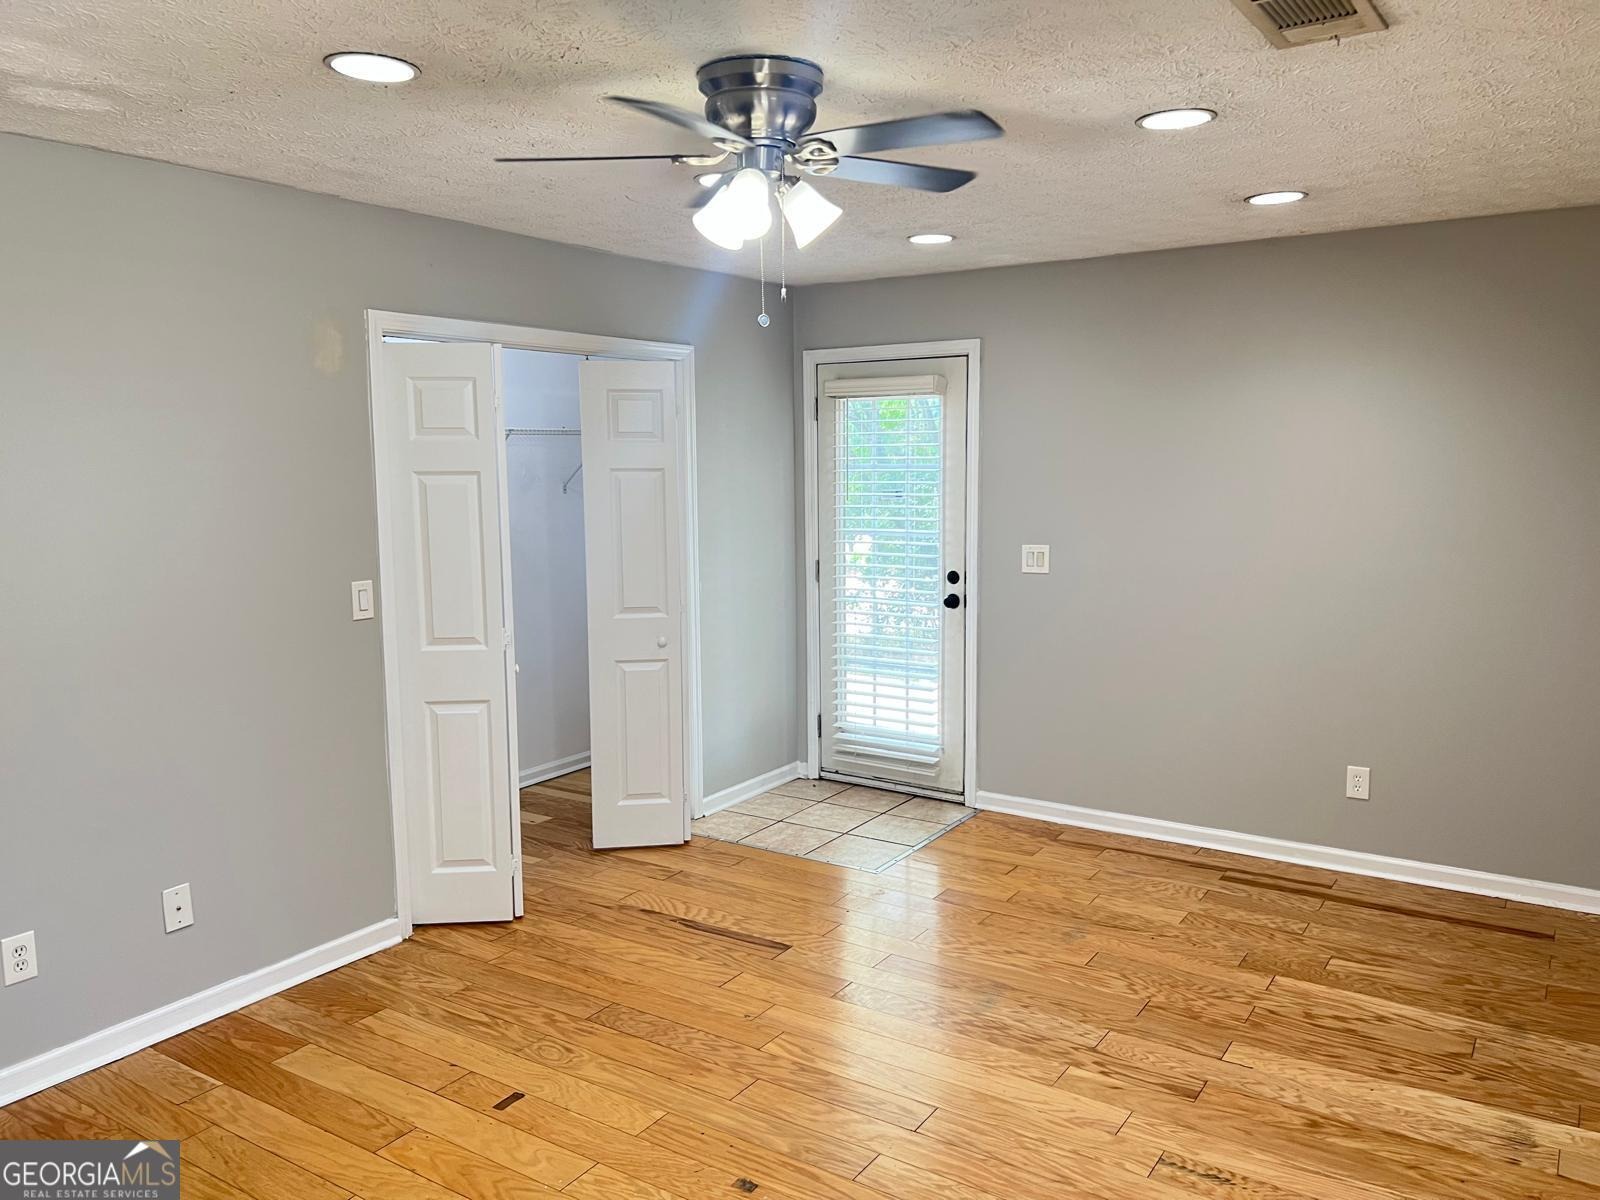
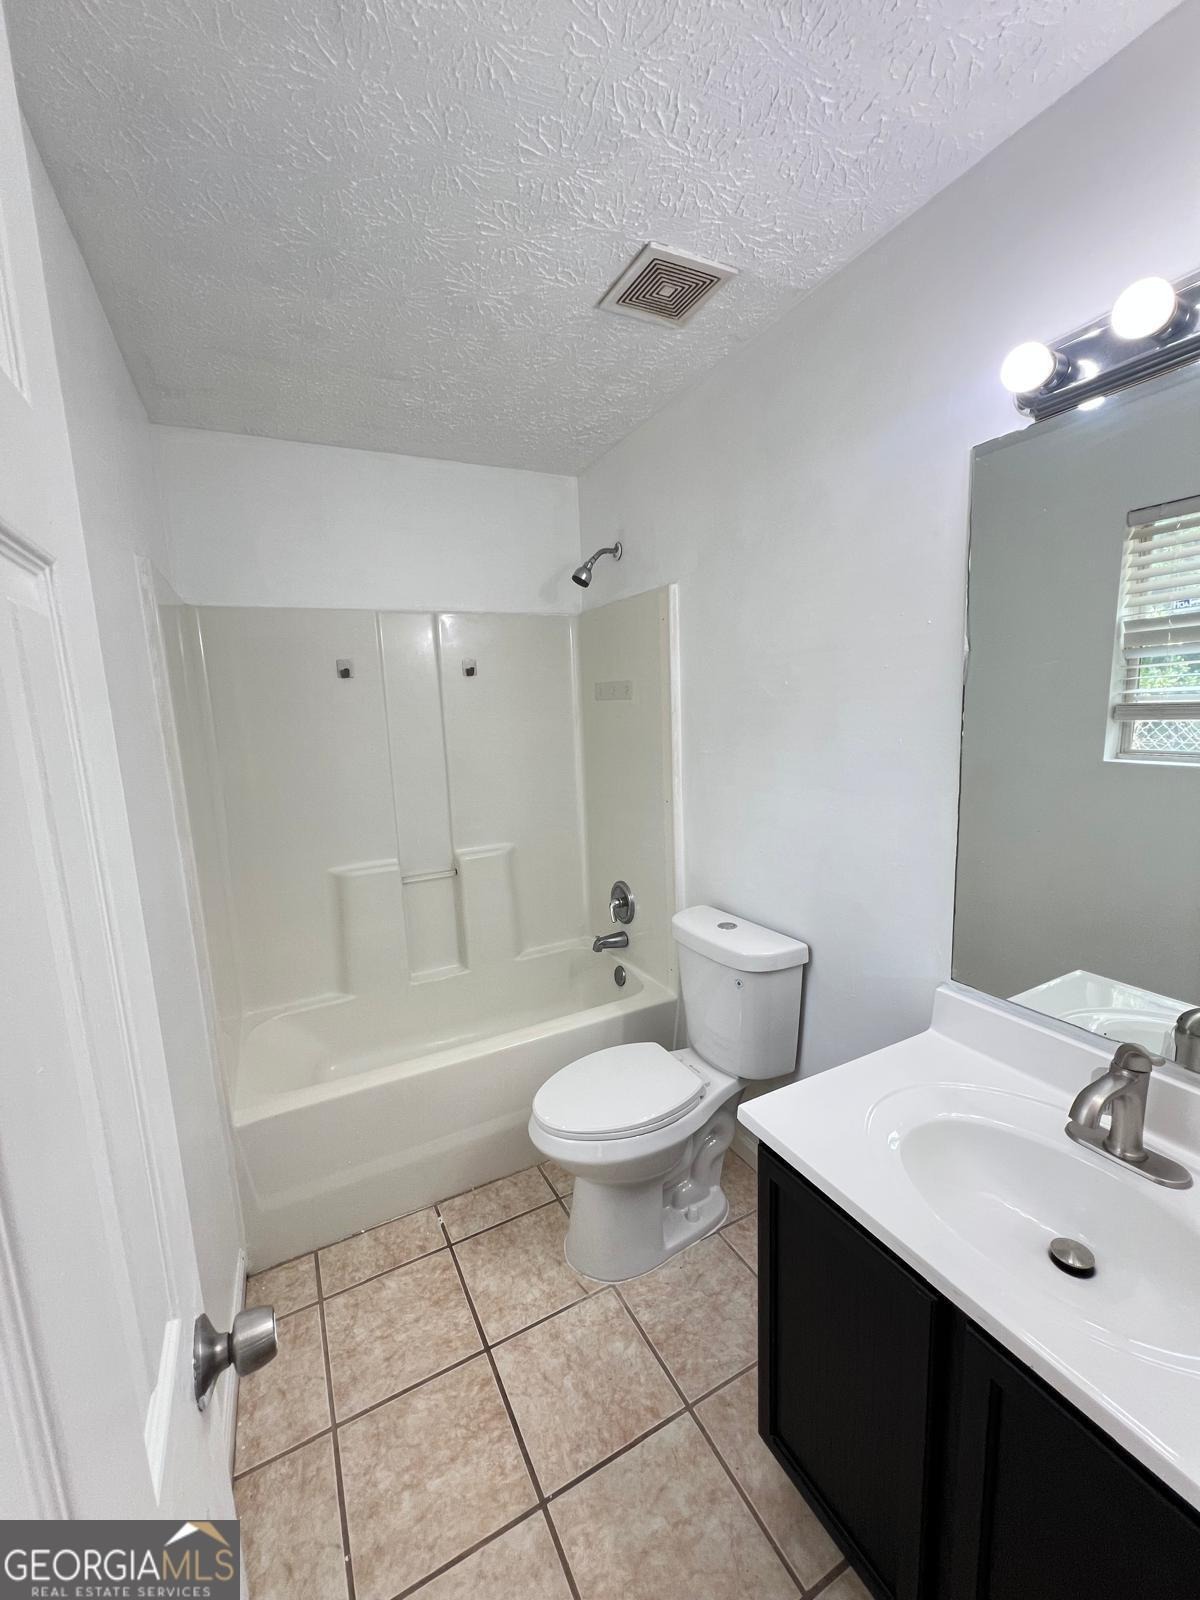
Discover a rare opportunity to acquire a fully stabilized 10-property single-family rental portfolio strategically located throughout South Atlanta and North Clayton County. This professionally managed portfolio offers immediate cash flow with an in-place 6.92% cap rate and approximately $202,000 in annual NOI. Each property has undergone extensive renovations, including roofs, HVAC systems, electrical, plumbing, kitchens, bathrooms, flooring, and other major capital improvements, significantly reducing near-term maintenance exposure. Assets are geographically concentrated within two efficient operational clusters, creating economies of scale and streamlined management. Ideal for institutional buyers, family offices, 1031 exchange investors, and portfolio operators seeking stabilized income-producing assets in high-demand rental submarkets. Complete offering memorandum, financials, and data room available upon request. Portfolio Sale Only. This property is one of ten income-producing rental assets offered as part of a bulk portfolio acquisition. Individual sales are not available.
Interior Details
1320
3
2
Has Heating:
No
Heating Type:
None
Has Cooling:
Yes
Cooling Type:
N/A
Has Fuel:
No
Fuel Type:
N/A
Has Basement:
No
Basement Type:
N/A
Has Flooring:
No
Flooring Type:
N/A
Has Fireplace:
Yes
Fireplace Type:
N/A
Property Details
734
Yes
Yes
Type:
N/A
Location:
N/A
Status:
N/A
Number of Spaces:
N/A
No
No
No
No
No
No
No
Construction Details
Ranch
N/A
N/A
N/A
N/A
Tax History
Year
Amount
Land
Improvement
Percent Change
Assessment
2019
$1,278
$5,600
$31,576
--%
$37,176
2019
$1,278
$4,800
$30,143
--%
$34,943
2018
$1,264
$4,800
$29,730
--%
$34,530
2017
$1,039
$4,800
$23,355
--%
$28,155
2016
$910
$4,800
$19,731
--%
$24,531
2014
$715
$5,600
$13,957
--%
$19,557
2013
$518
$0
$0
--%
$13,898
2012
$595
$0
$0
--%
$15,960

Average Home Price in 30297
Nearby Properties
Zip Code
Price
Bed
Bath
Sqft
Lot
Sold Date
$44,699
3 Beds
1 Baths
1,453 Sqft
15,078 Lot (sqft)
Sold 10/06/2026
$104,836
3 Beds
1 Baths
1,225 Sqft
16,771 Lot (sqft)
Sold 07/28/2026
$170,000
2 Beds
1 Baths
1,191 Sqft
11,174 Lot (sqft)
Sold 10/27/2026
$299,900
3 Beds
3 Baths
1,467 Sqft
13,504 Lot (sqft)
Sold 11/02/2026
$169,900
3 Beds
2 Baths
1,216 Sqft
1,078 Lot (sqft)
Sold 10/27/2026
$194,690
3 Beds
2 Baths
1,274 Sqft
961 Lot (sqft)
Sold 10/27/2026
$159,900
4 Beds
2 Baths
1,378 Sqft
13,310 Lot (sqft)
Sold 10/26/2026
$160,578
3 Beds
1 Baths
1,421 Sqft
13,158 Lot (sqft)
Sold 10/13/2026
$171,017
3 Beds
2 Baths
1,275 Sqft
12,944 Lot (sqft)
Sold 10/13/2026