

Member Features
Find Real Estate Bargain!
Full foreclosure details
Home value, equity and ownership info
Find homes priced below market
Get full access with a FREE Account
Already a member?
$324,900
Listing Price3beds
1baths
1,493sqft
1,742sqft lot
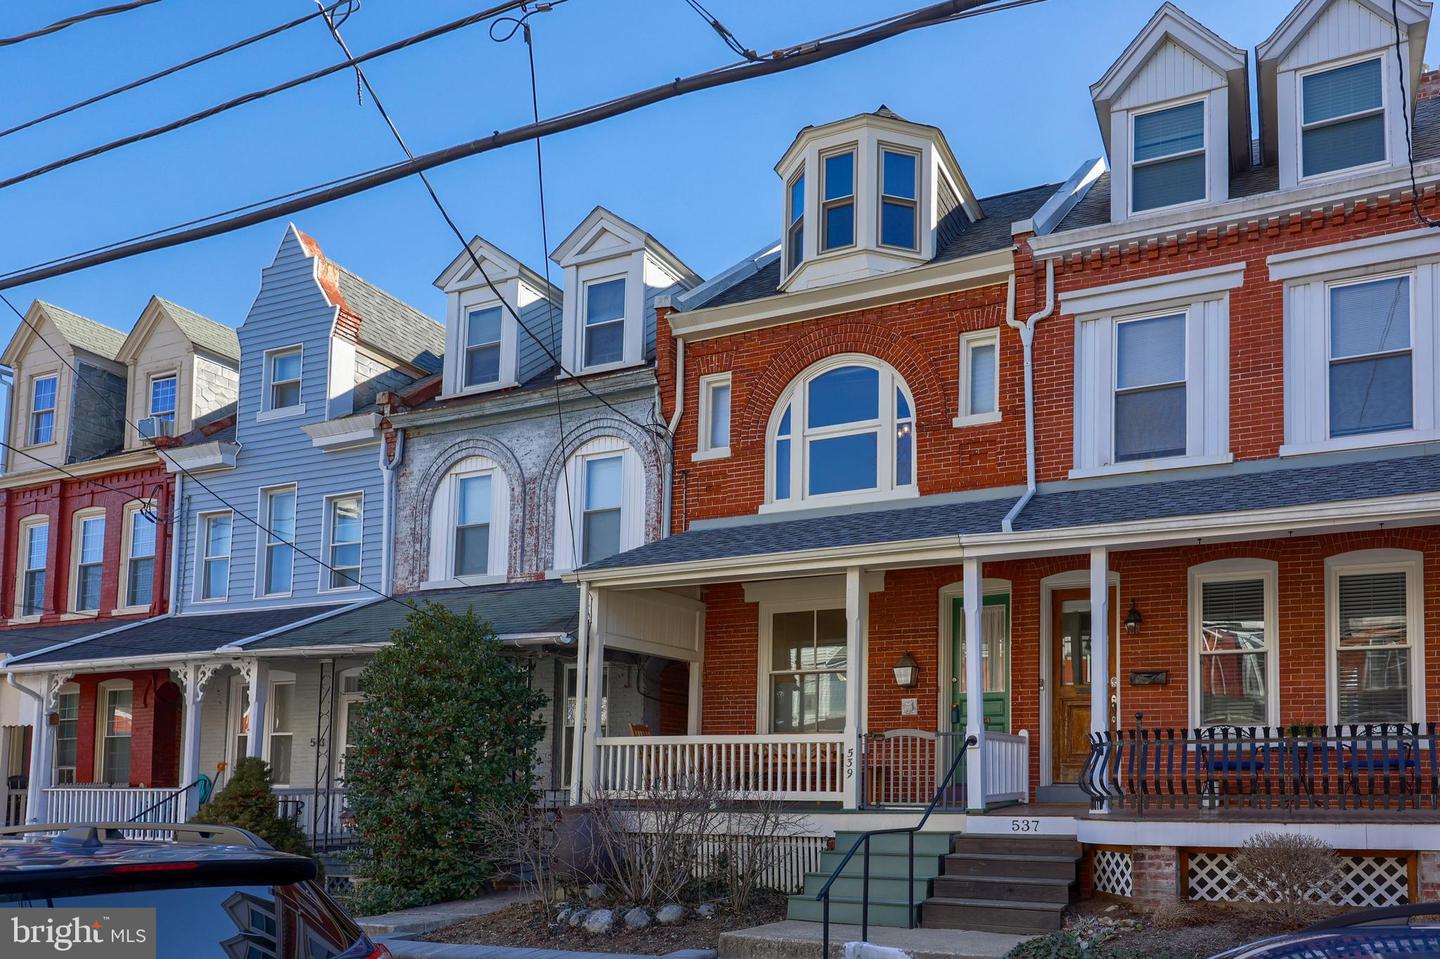
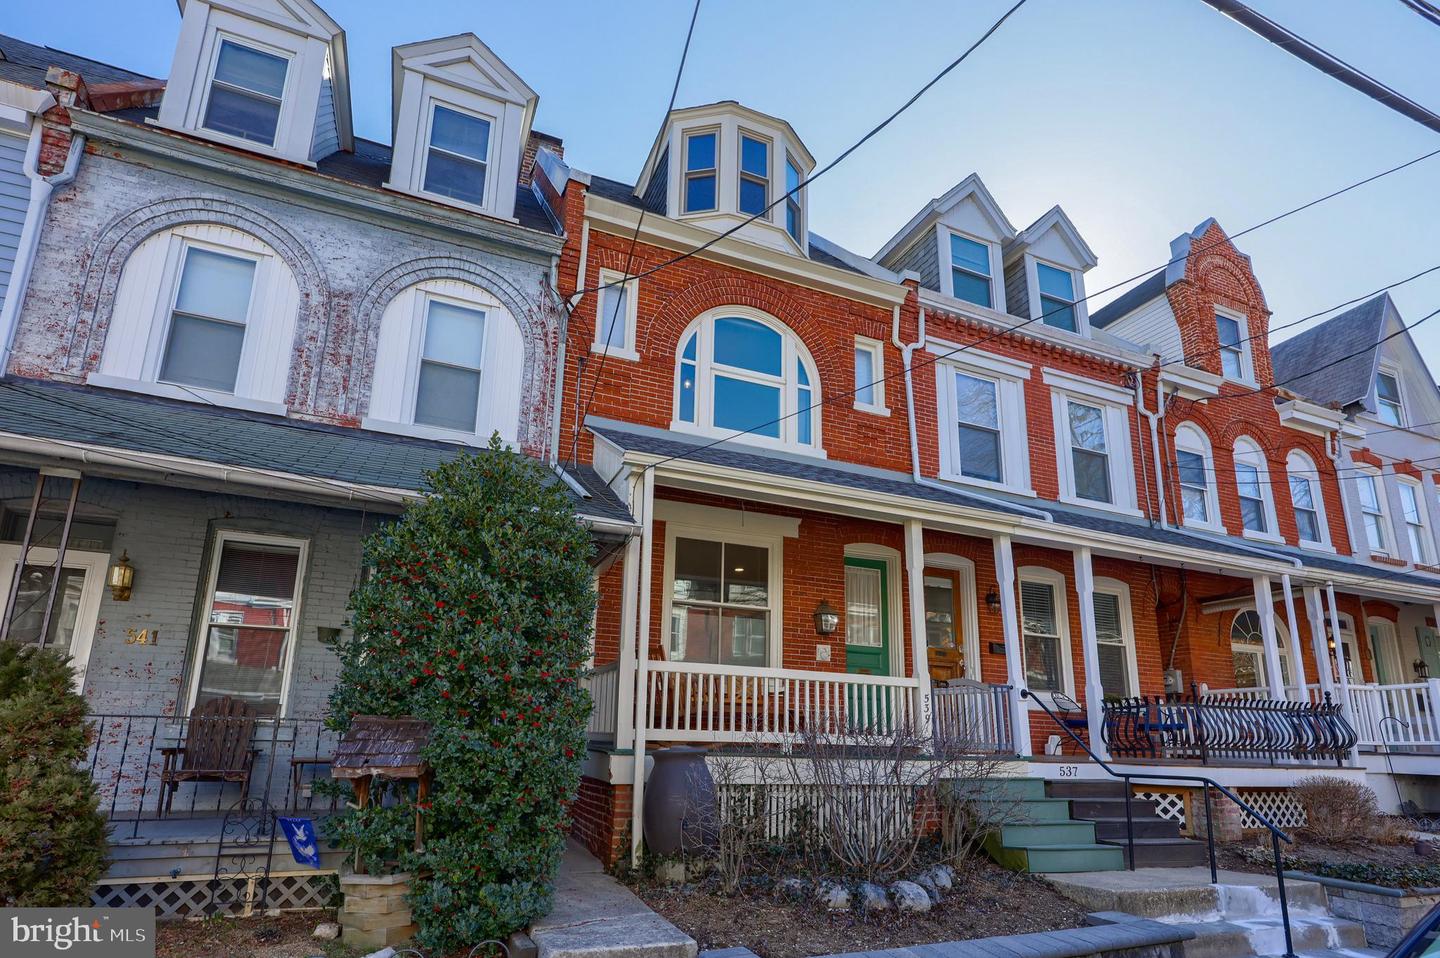
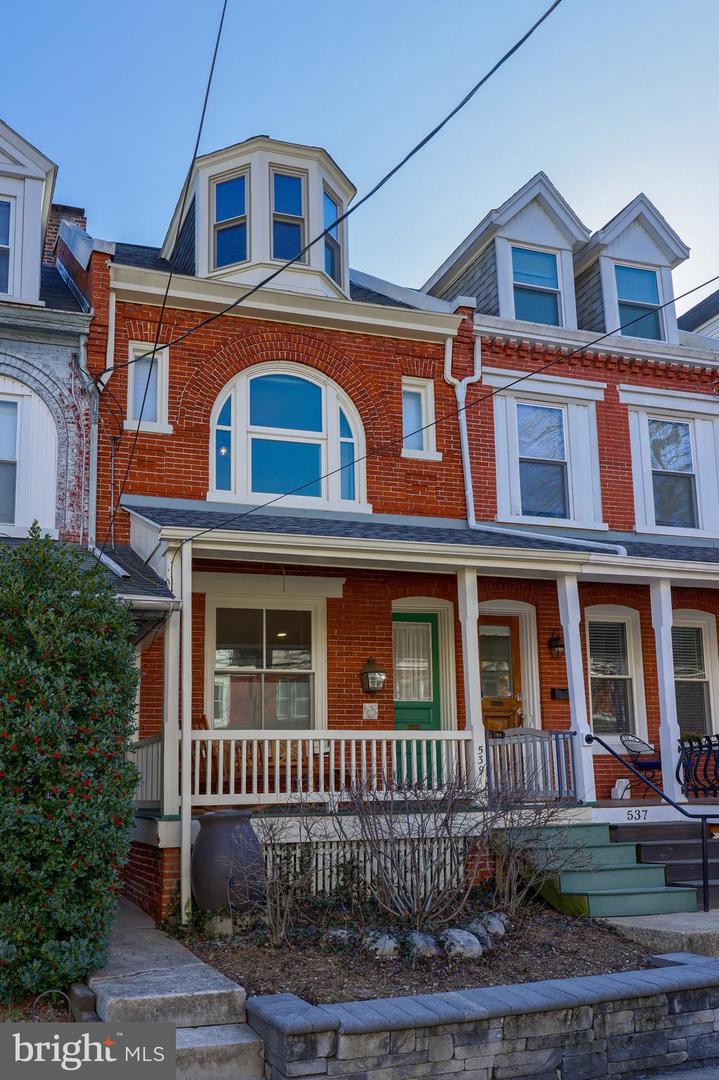
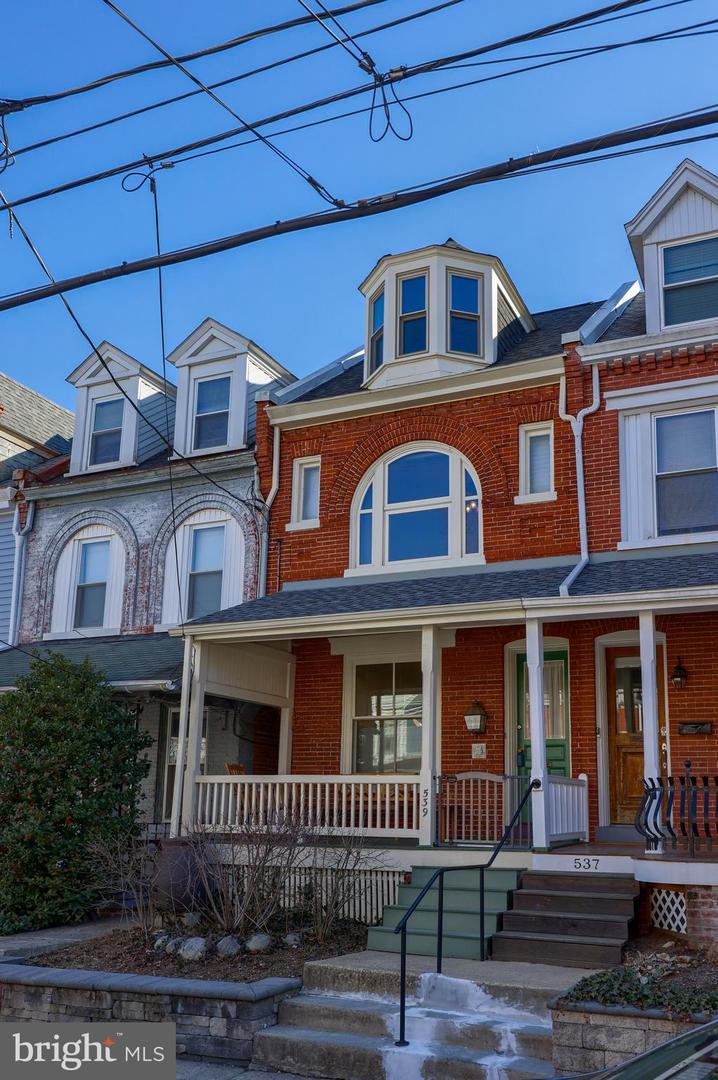
539 N Mary St, Lancaster, PA 17603
Member Features
Find Real Estate Bargain!
Full foreclosure details
Home value, equity and ownership info
Find homes priced below market
Get full access with a FREE Account
Already a member?
For Sale
Off Market
Home type
Price / sqft
Year built
Home Details
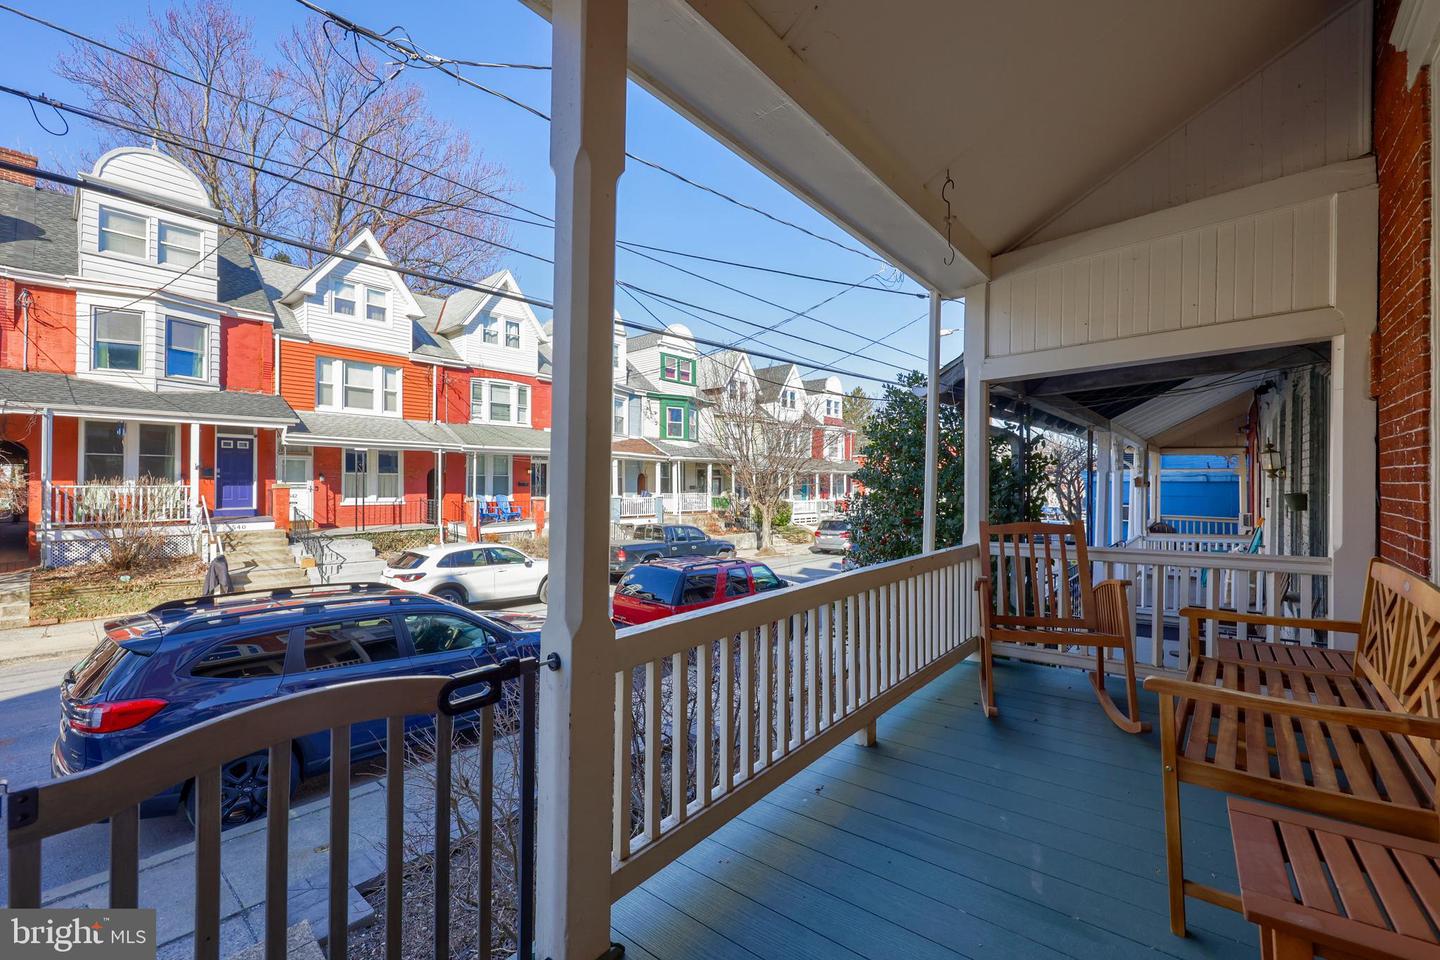
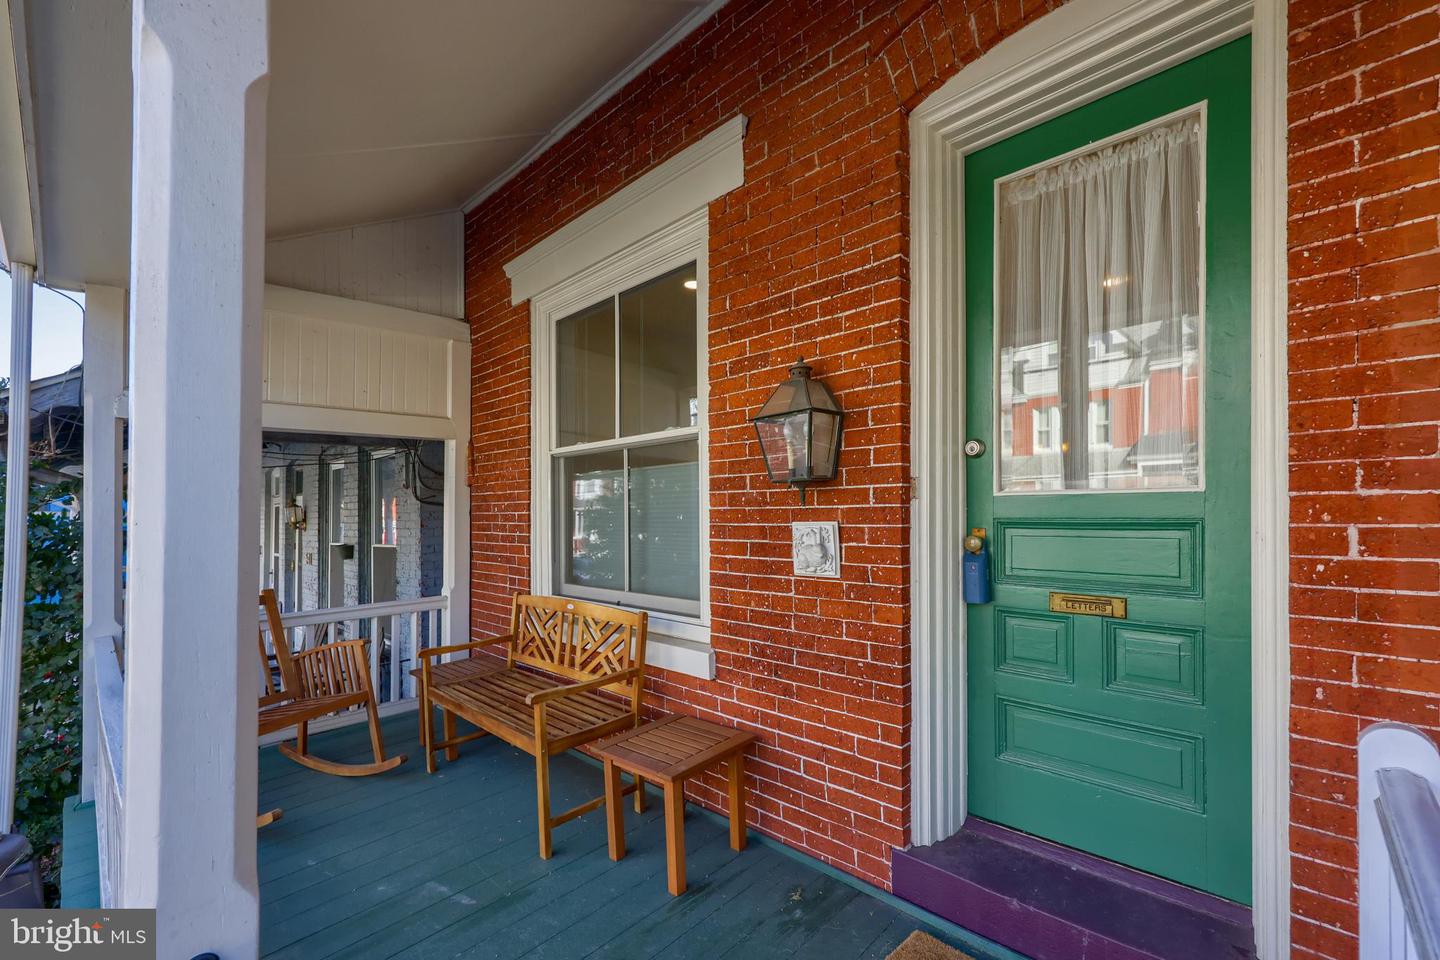
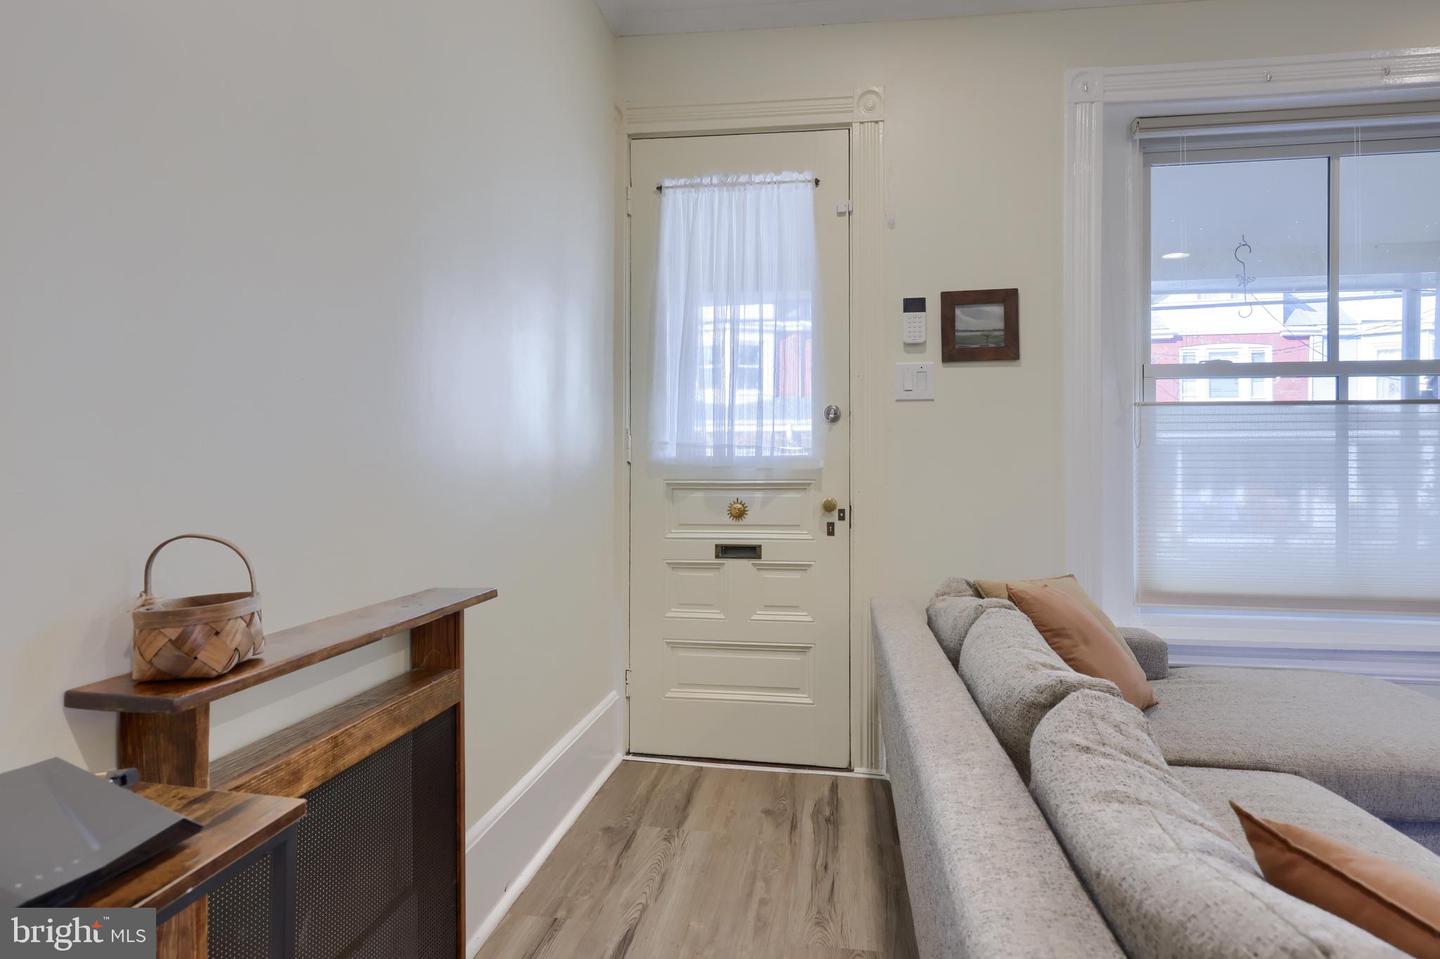
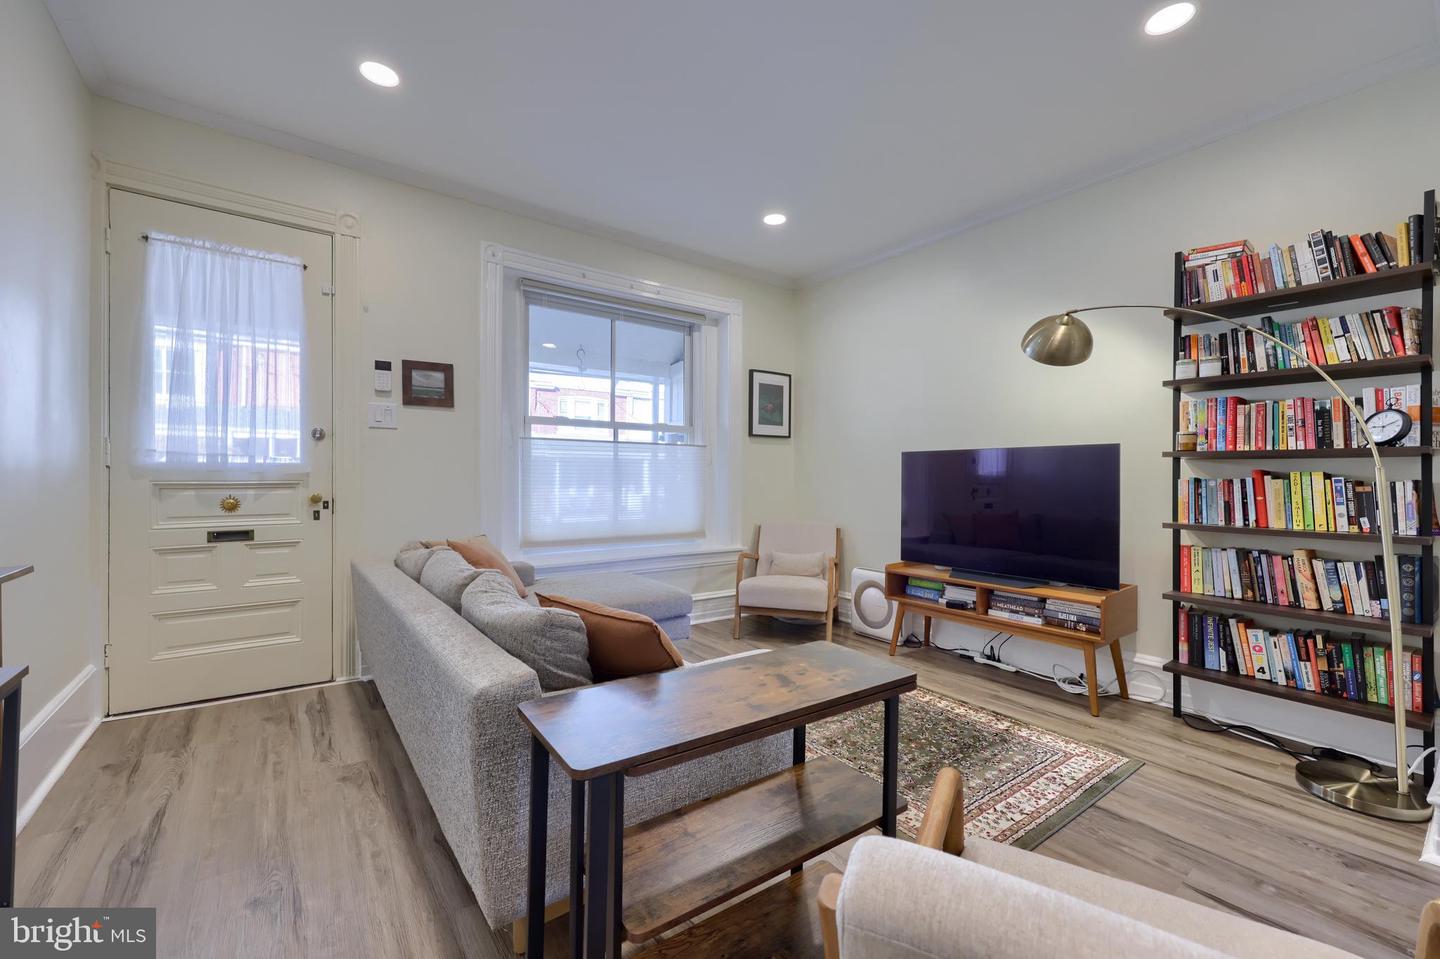
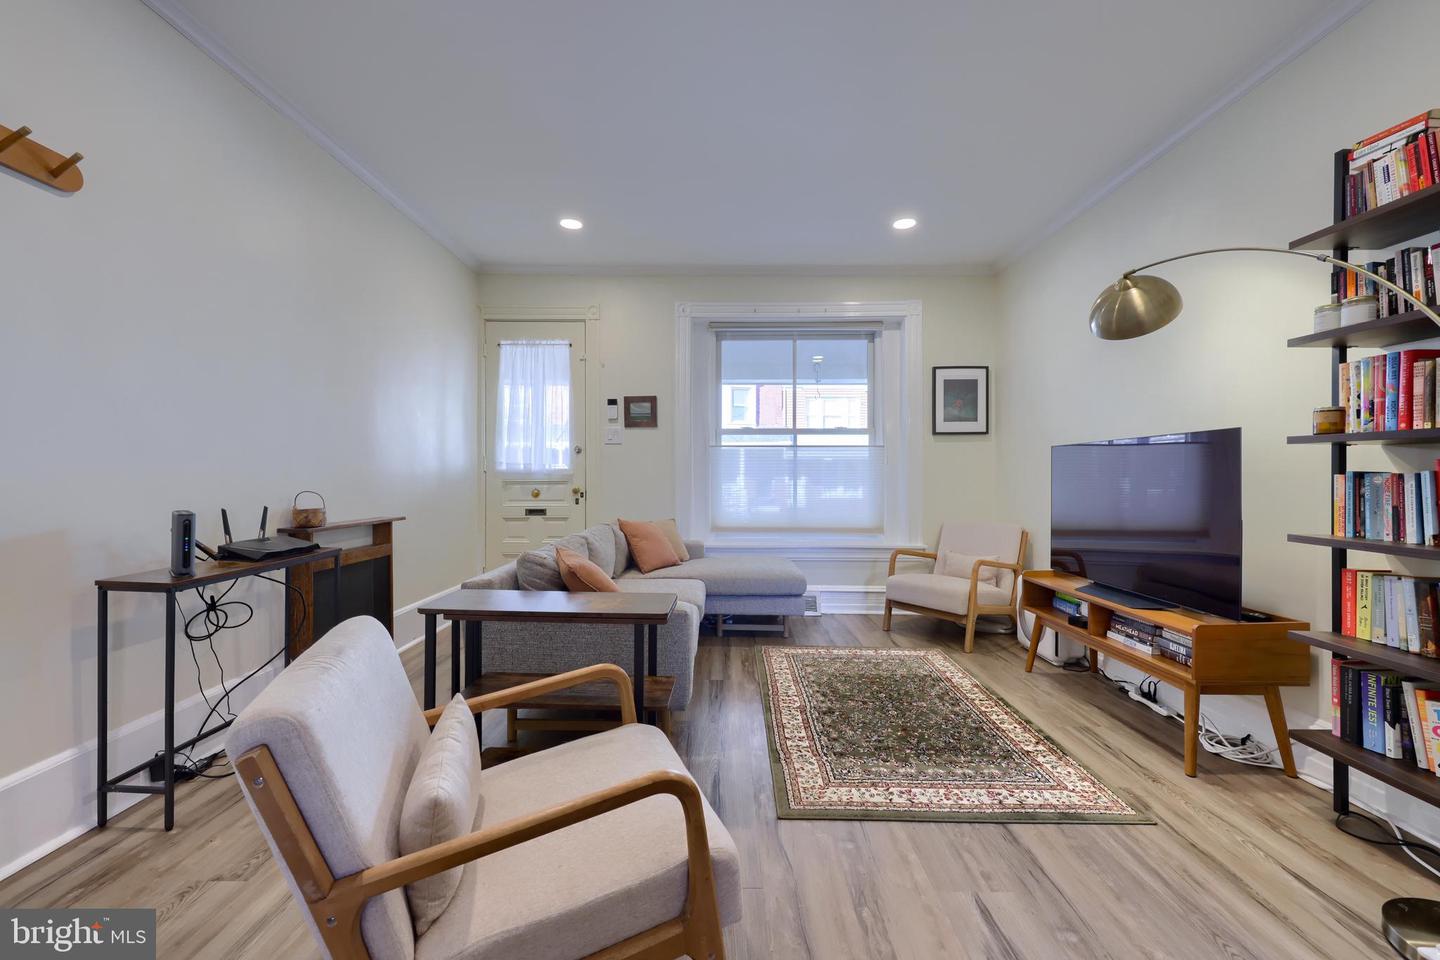
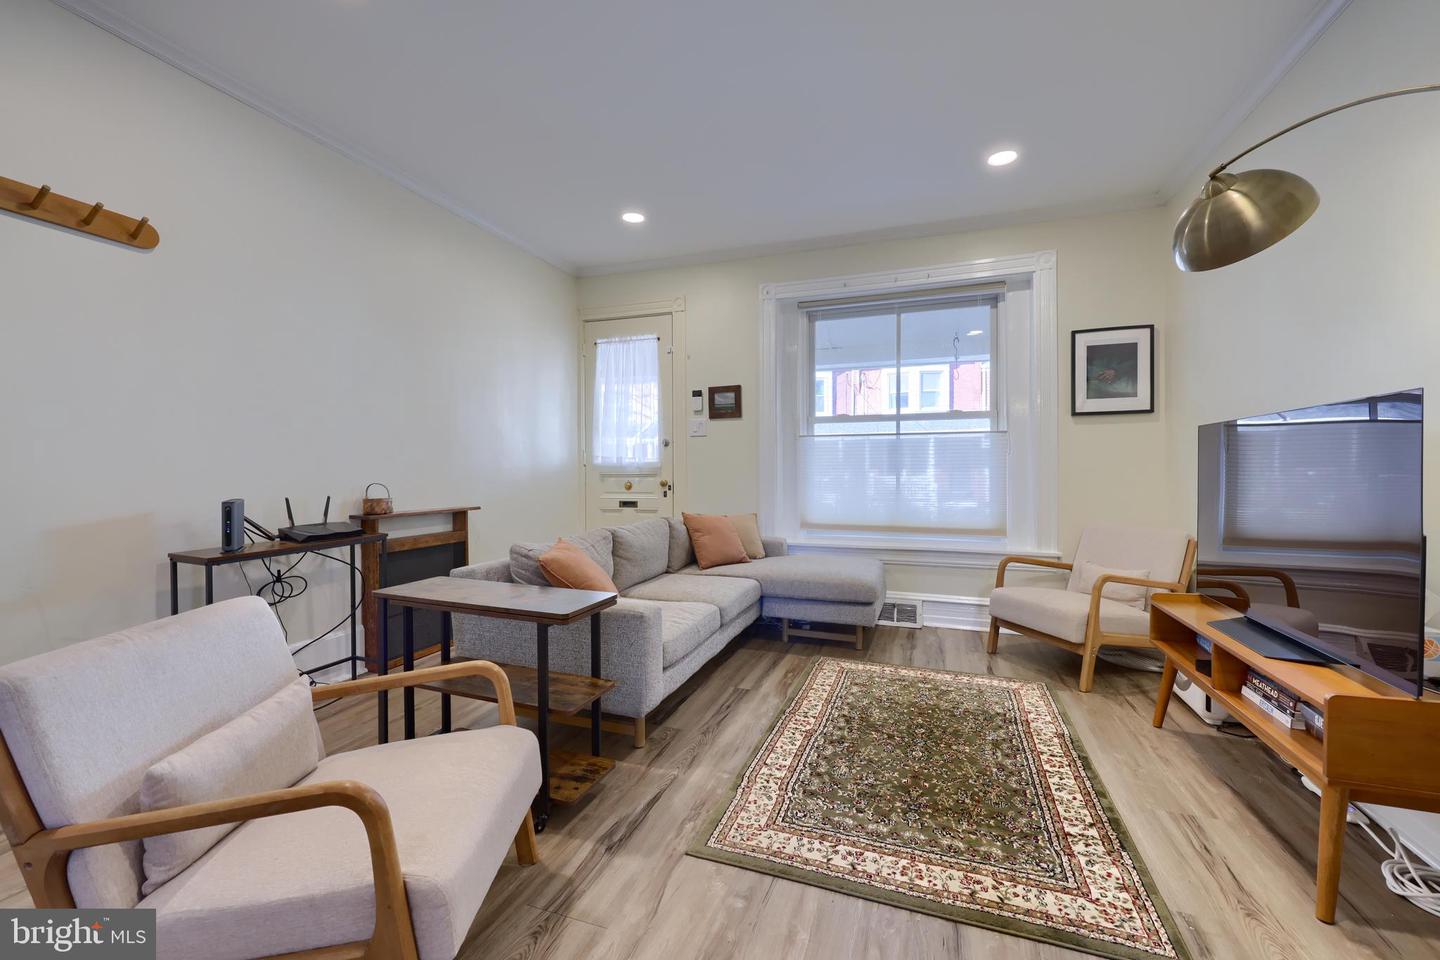
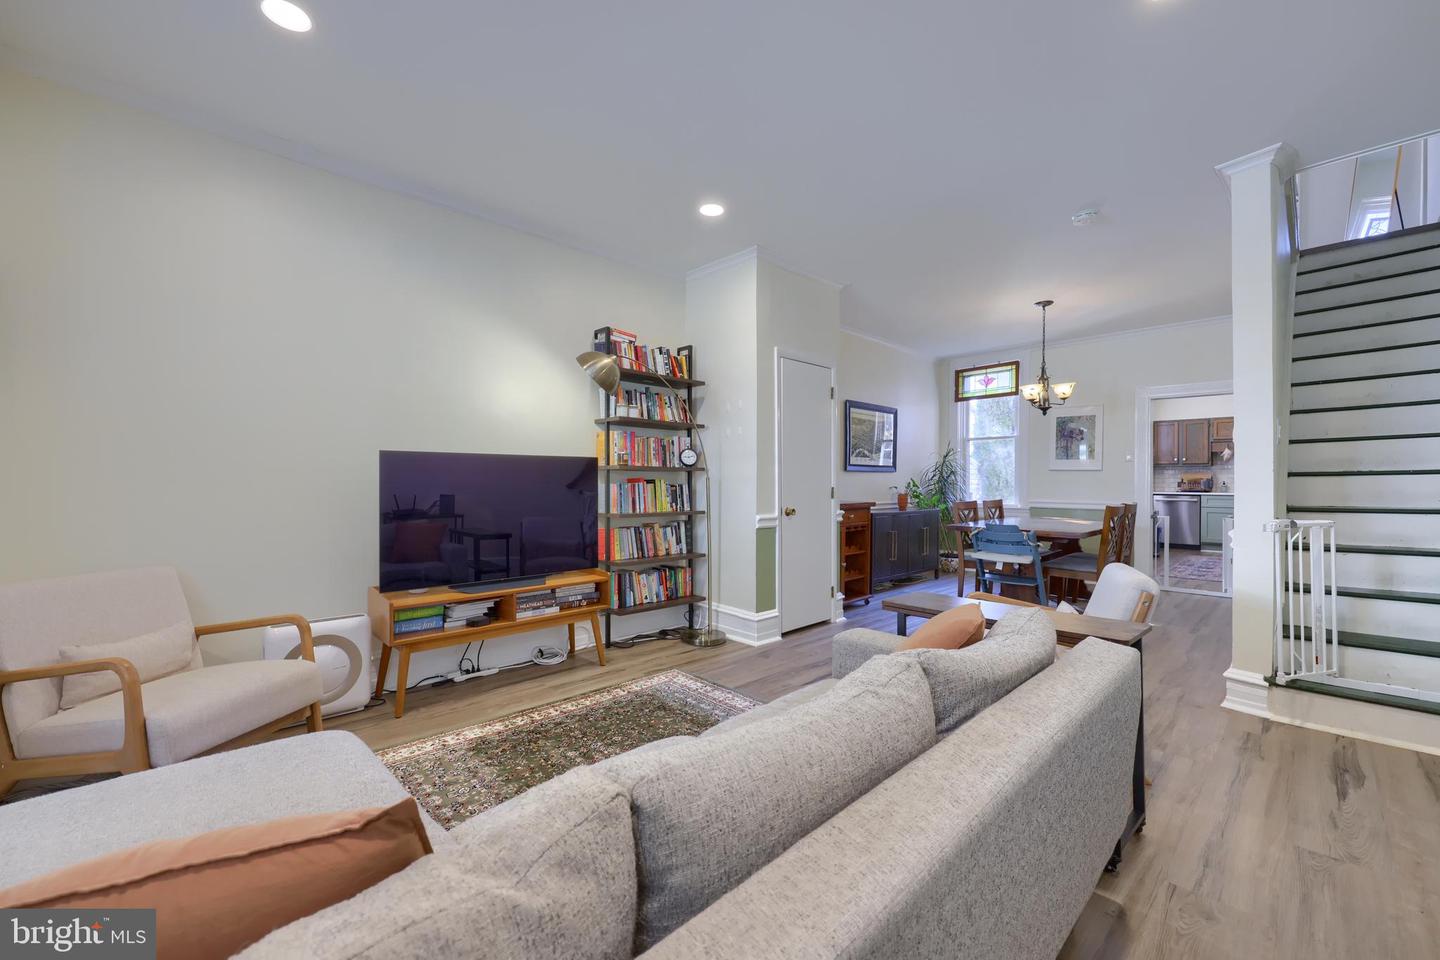
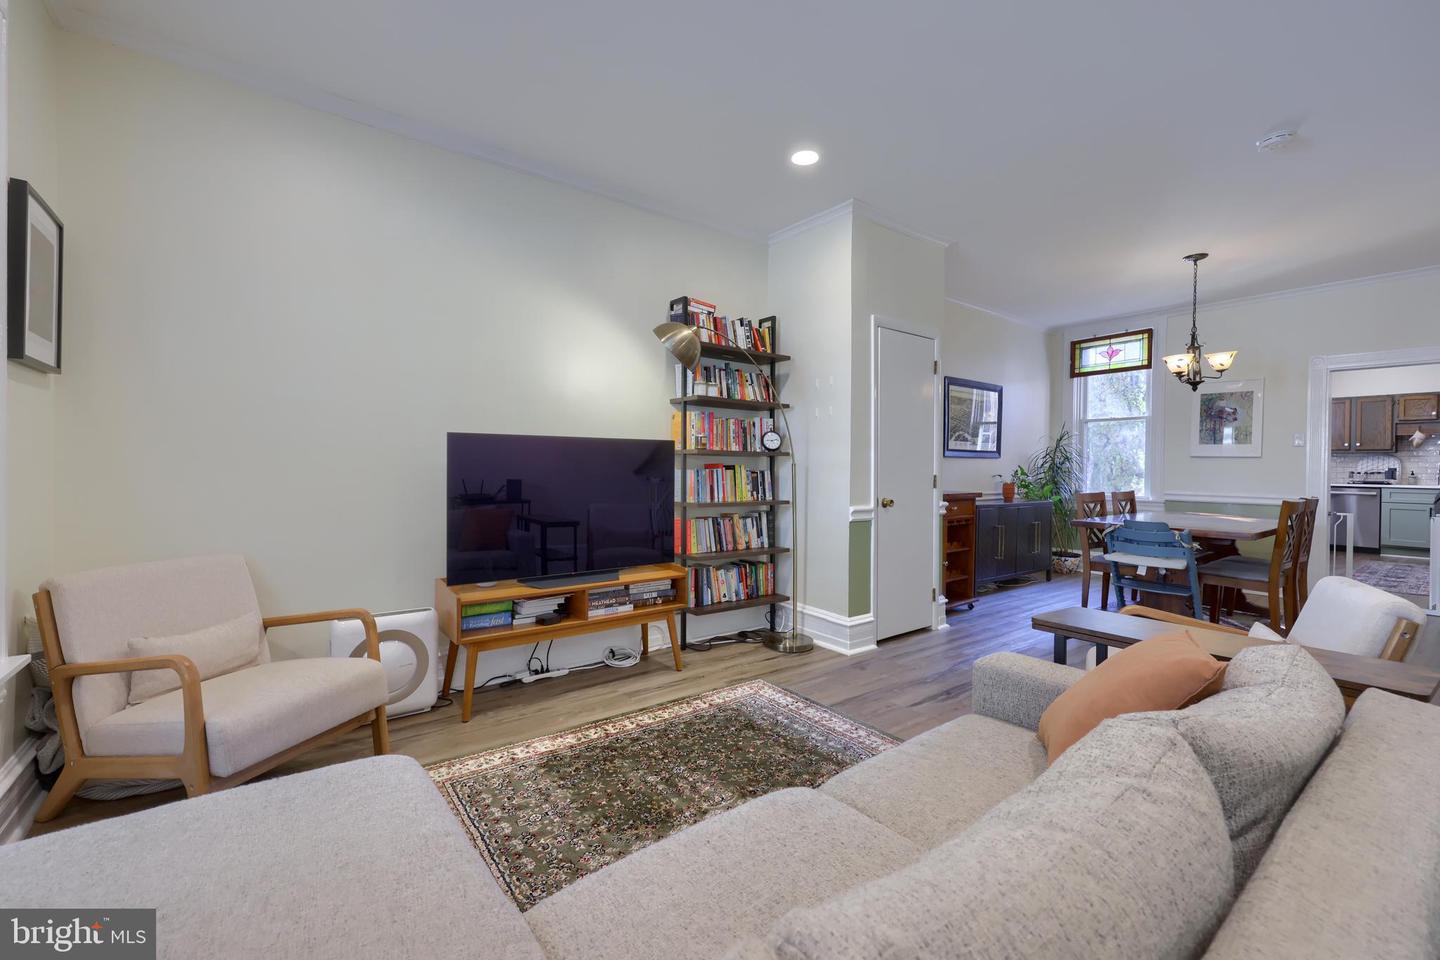
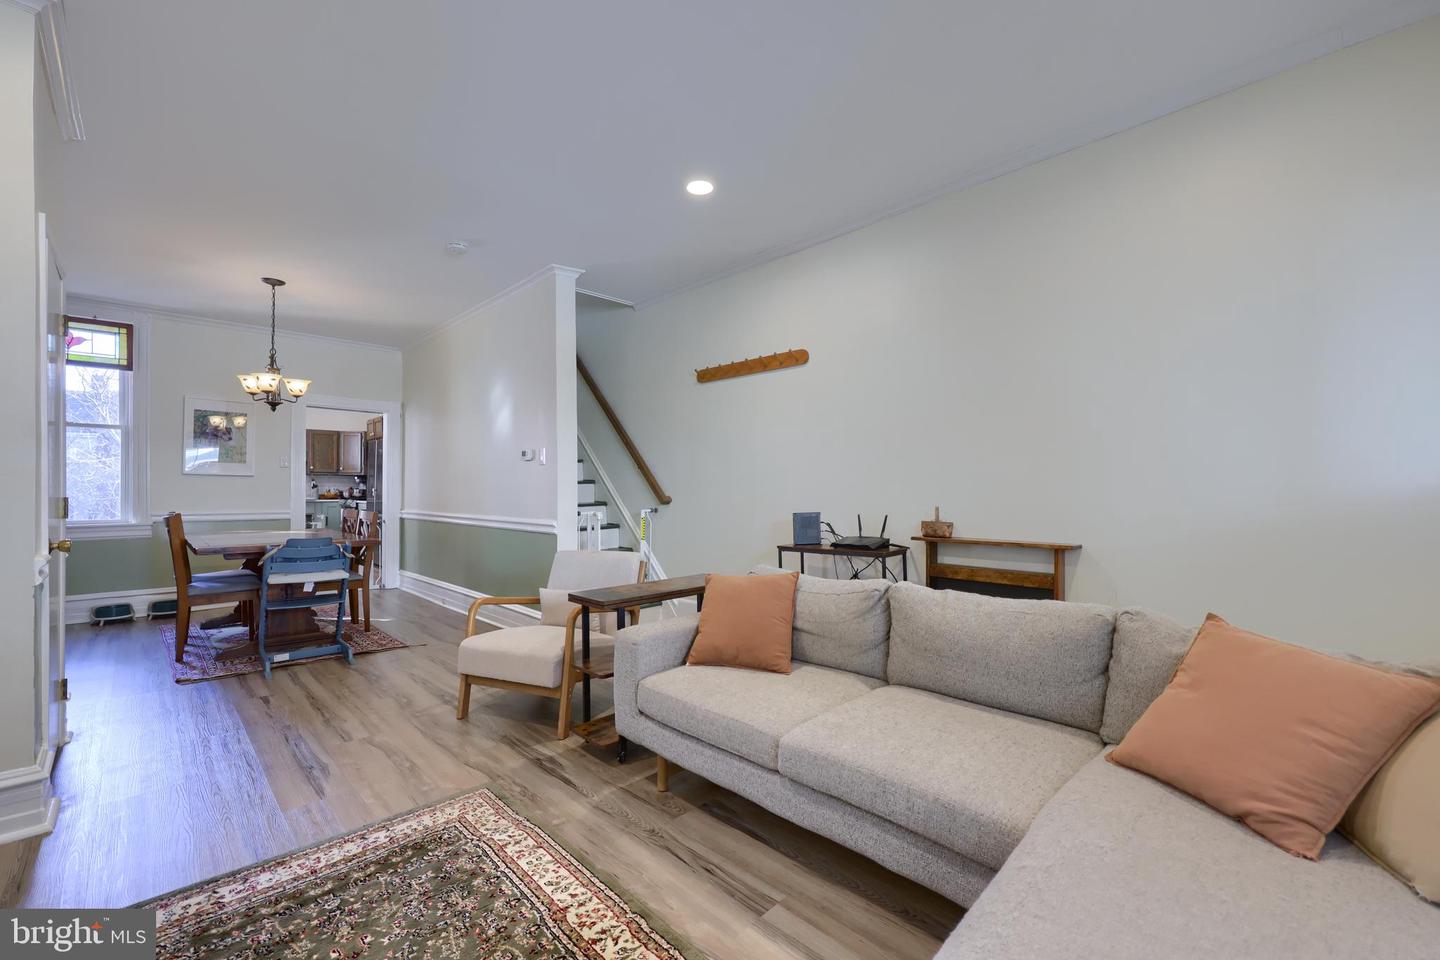
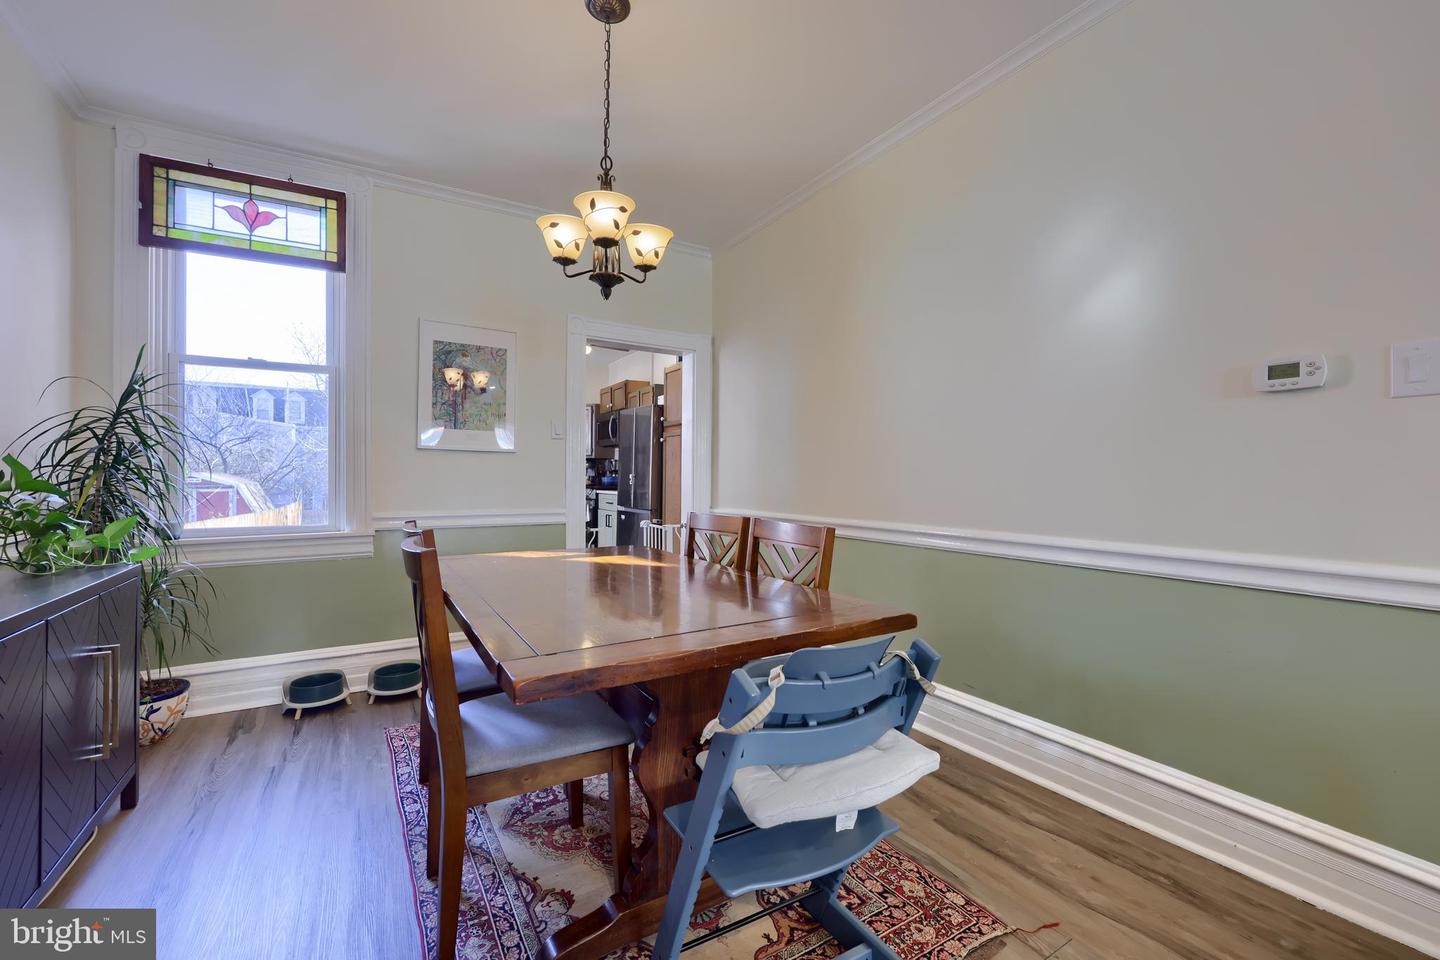
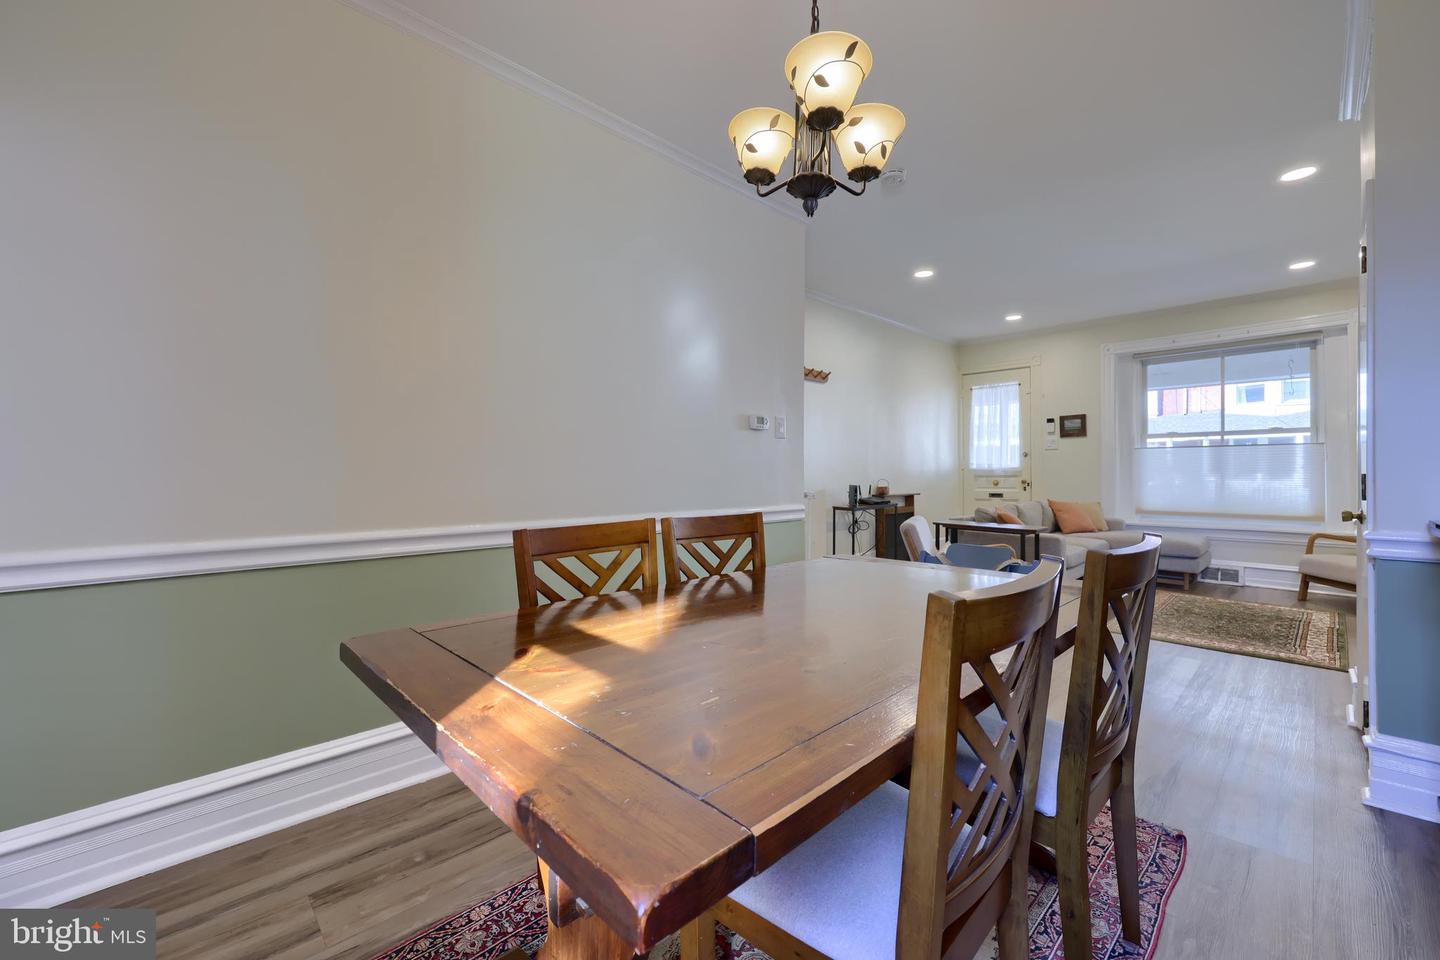
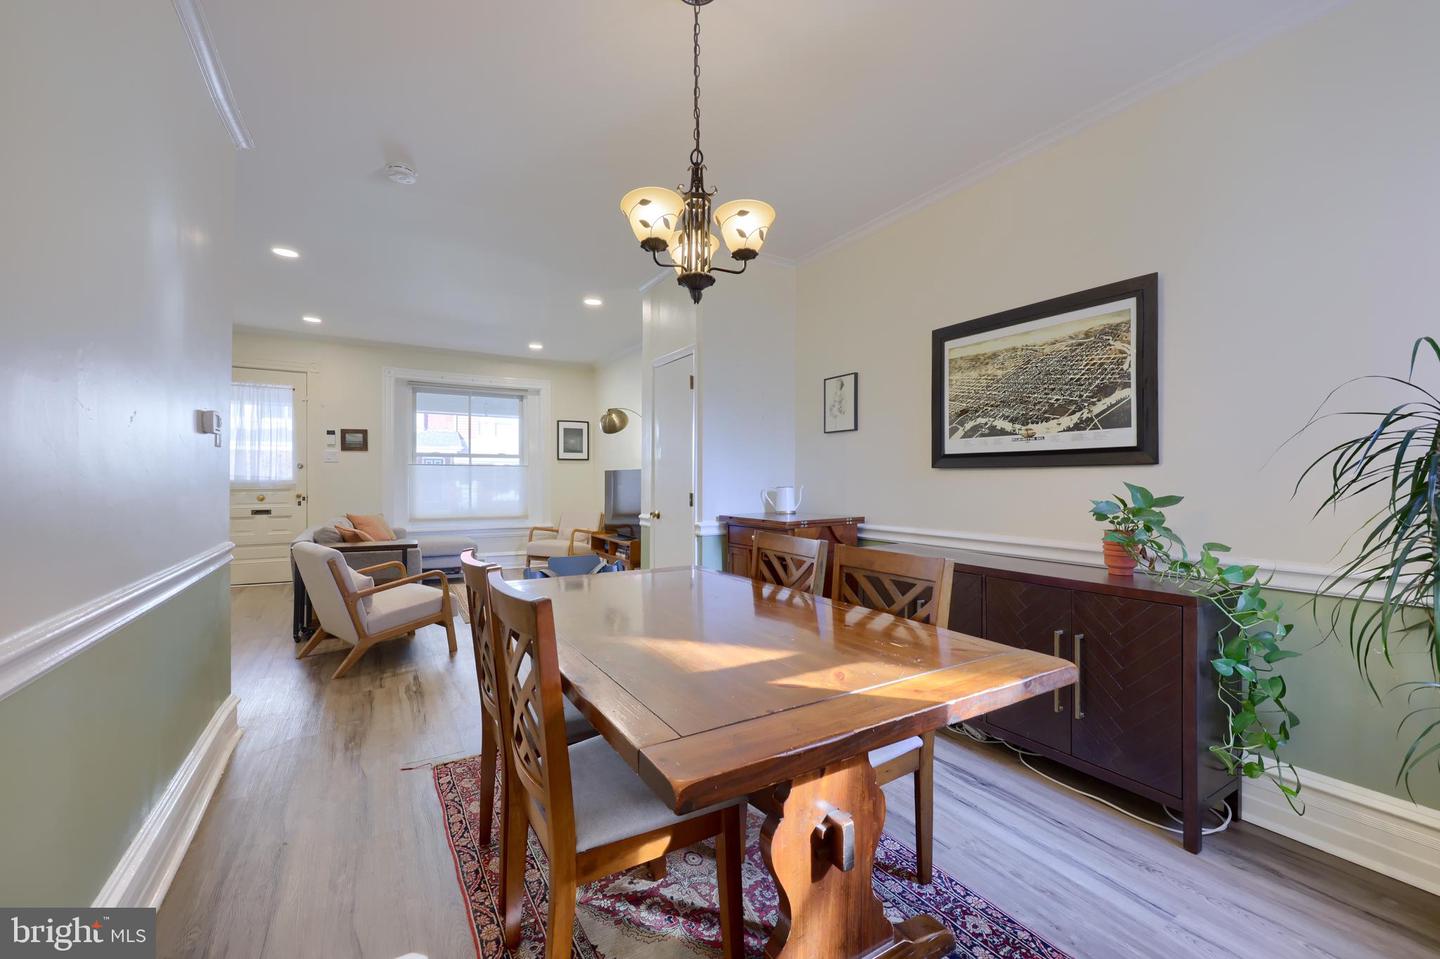
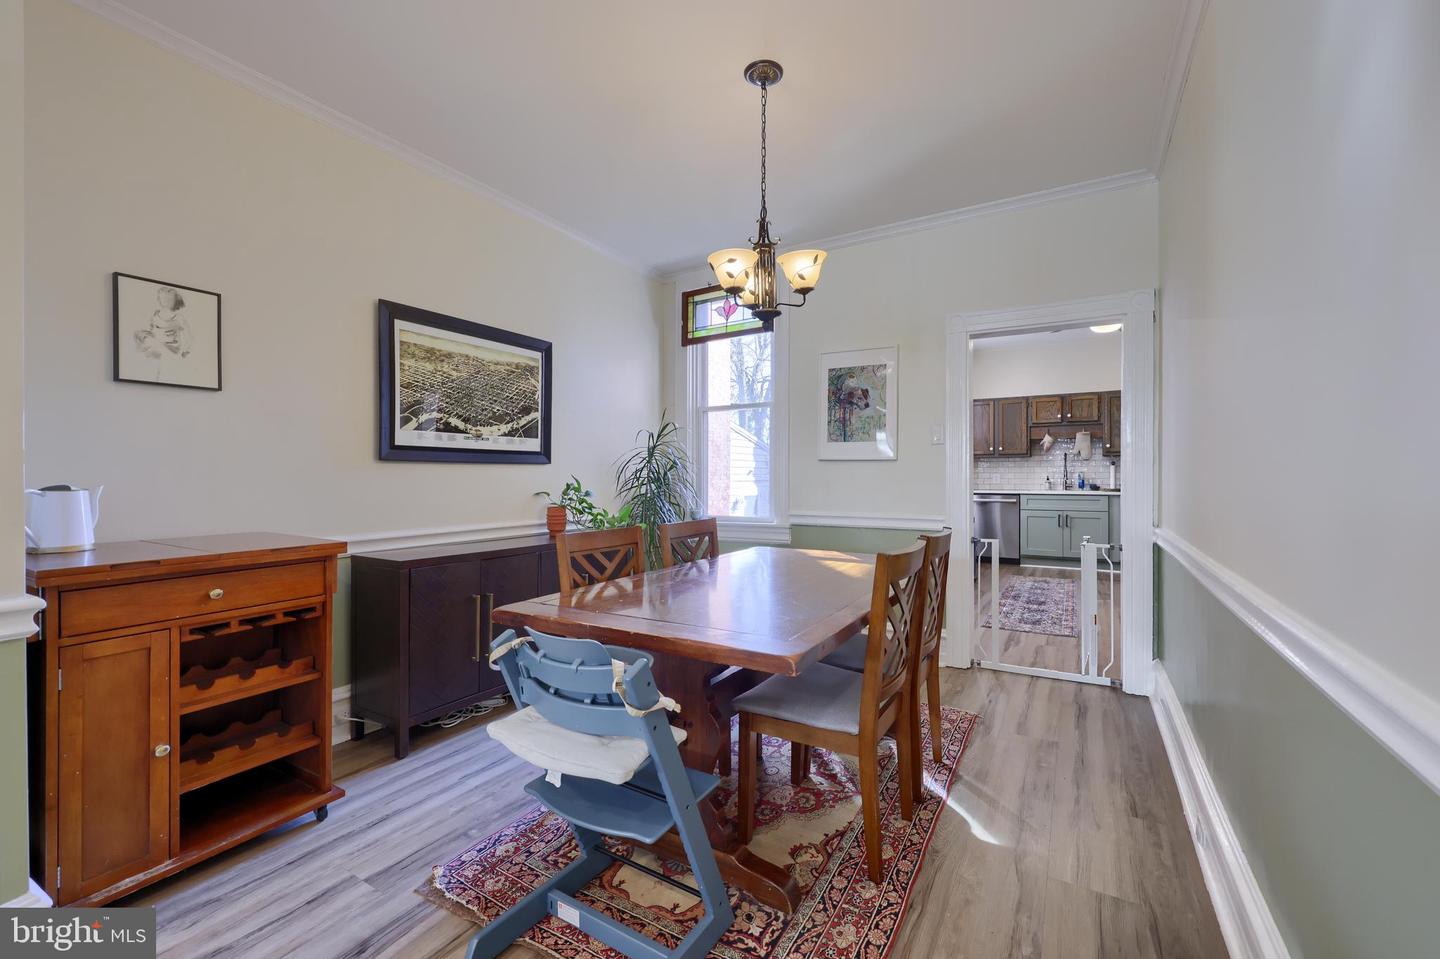
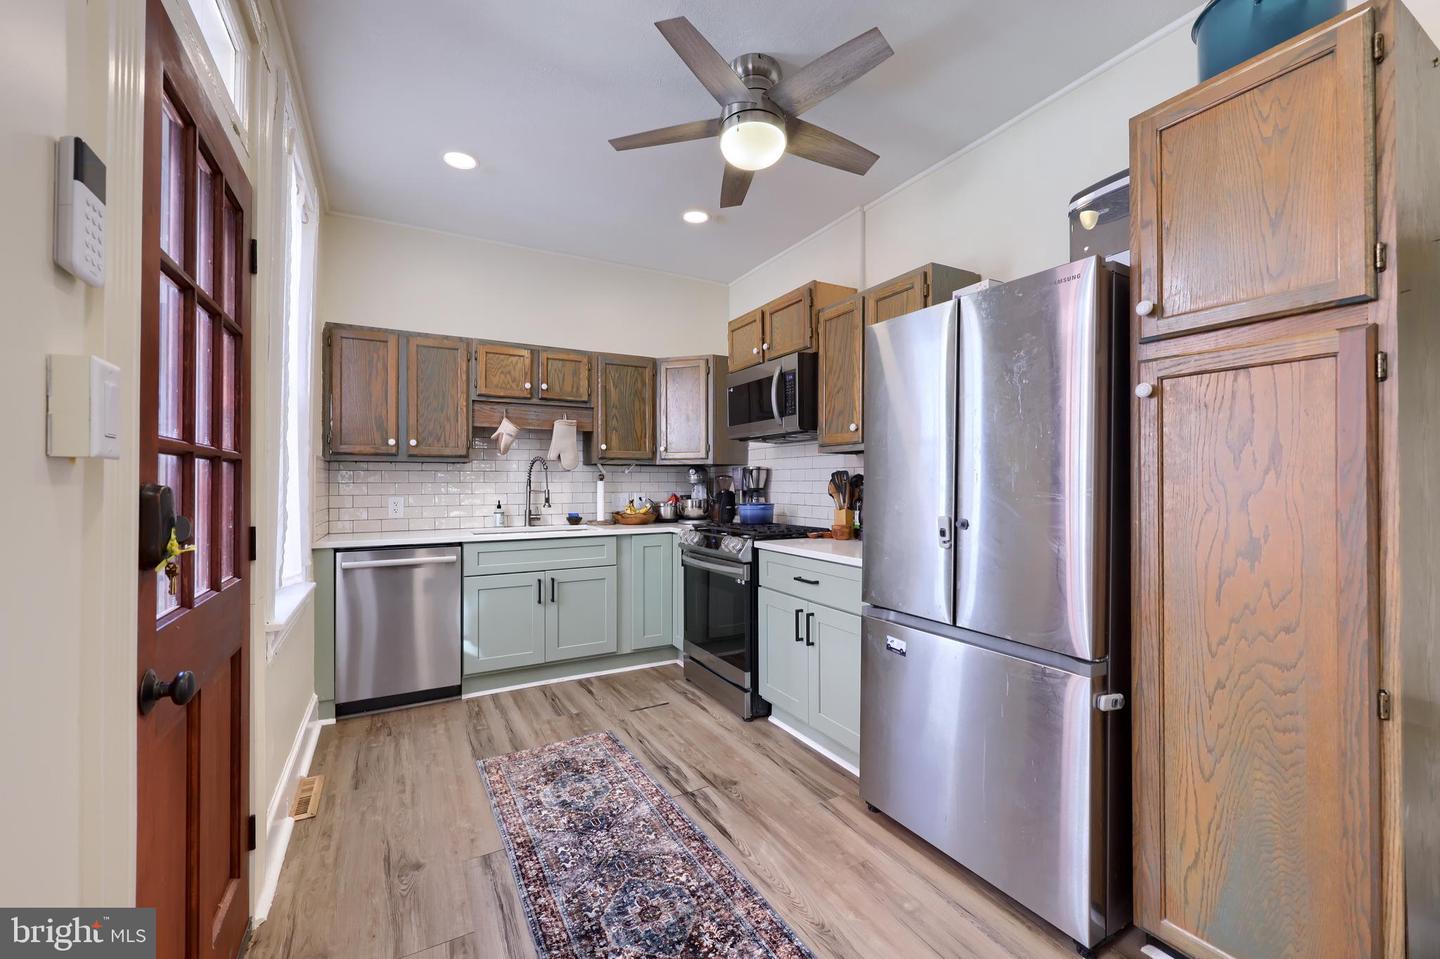
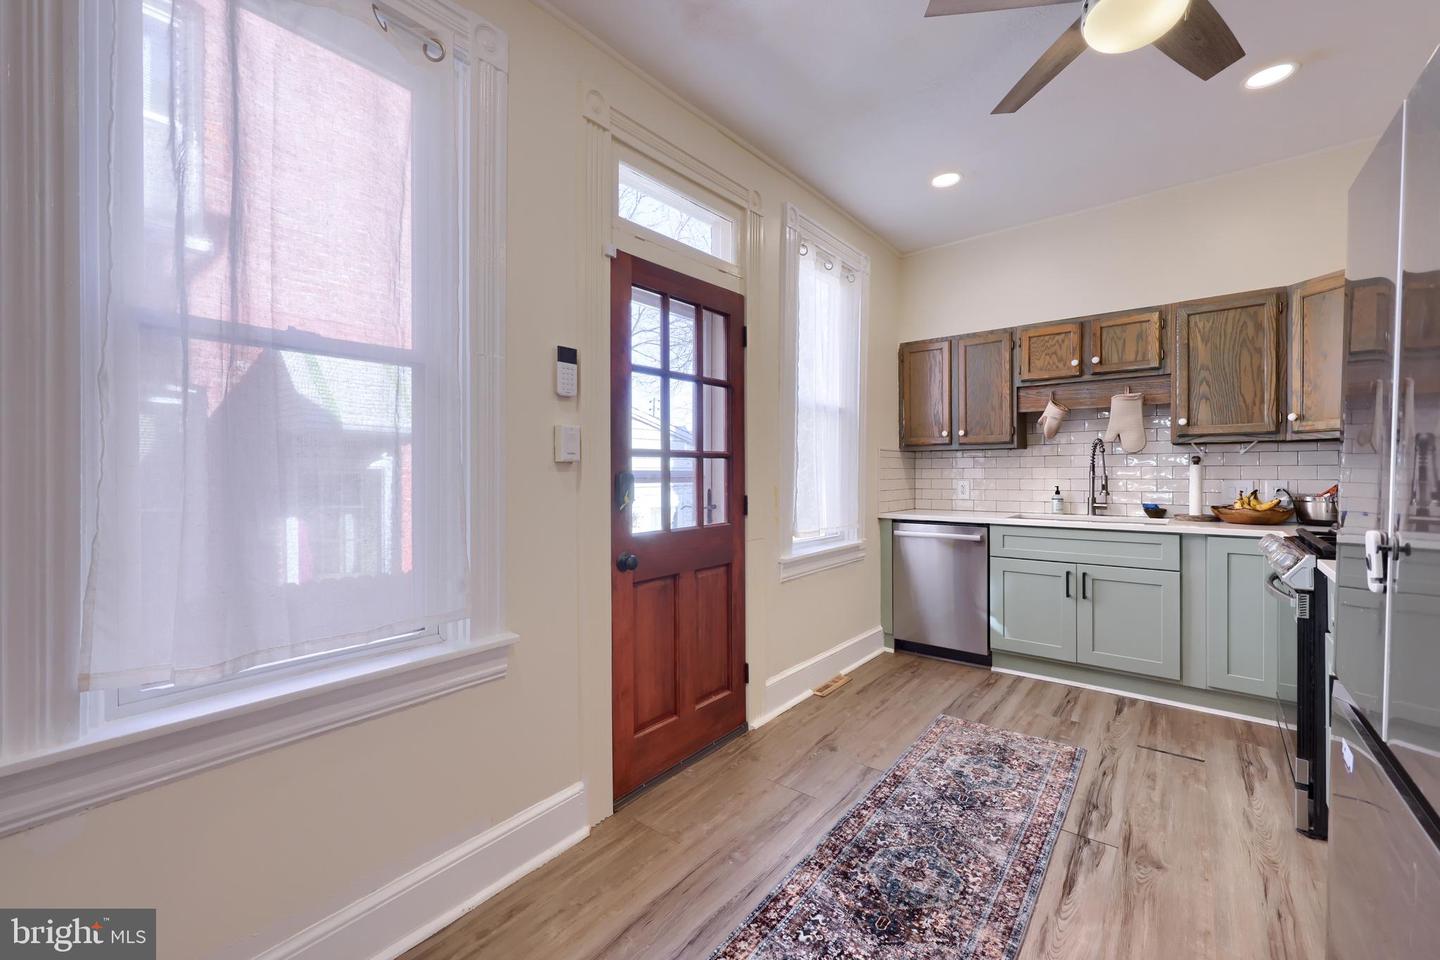
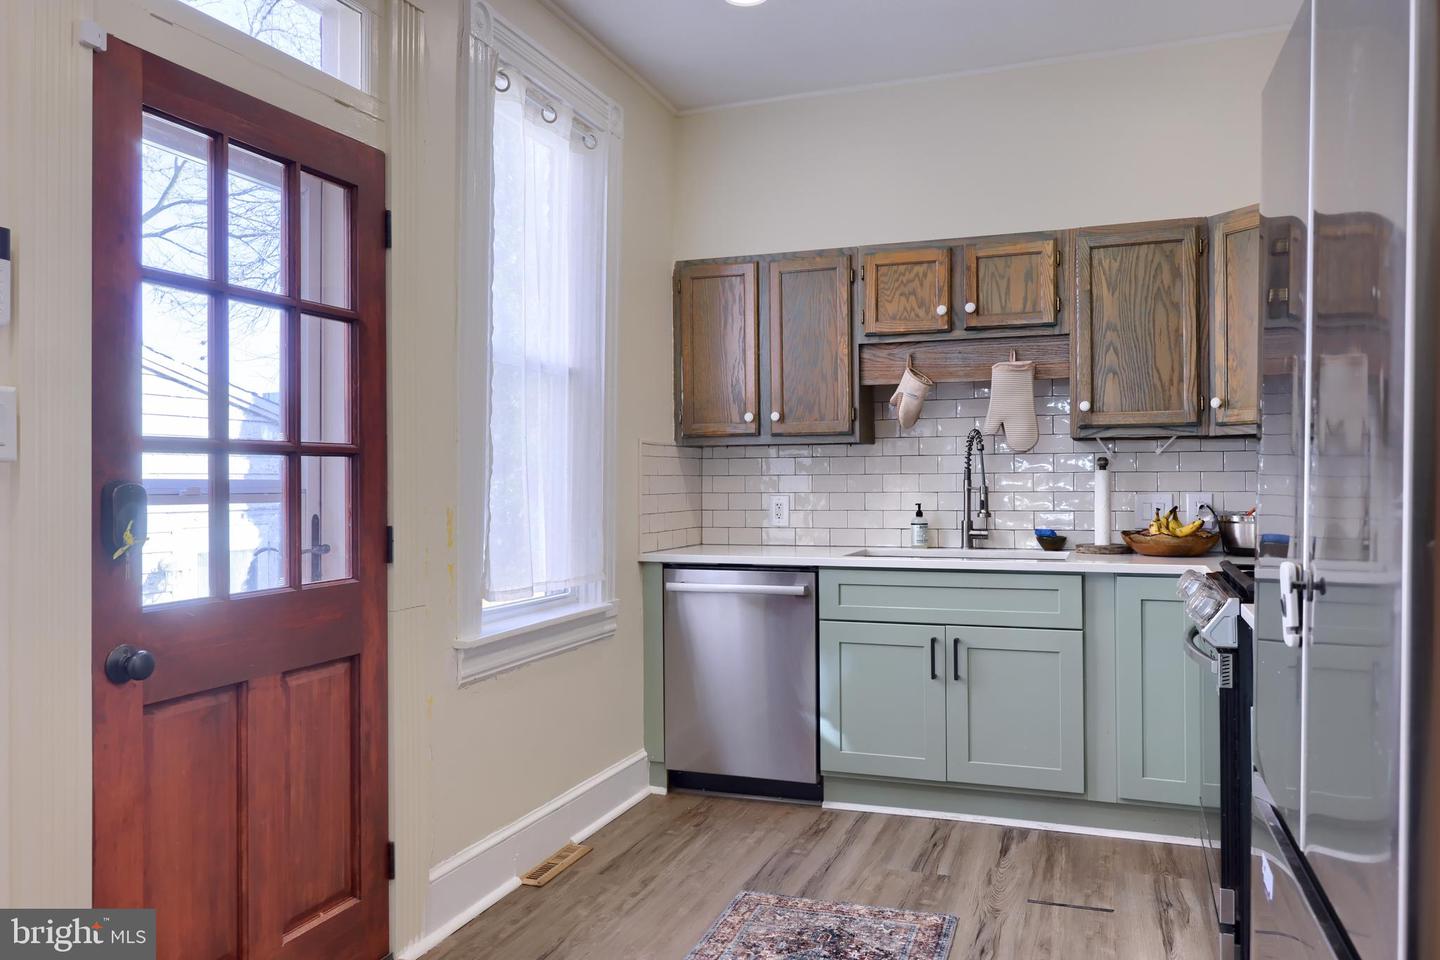
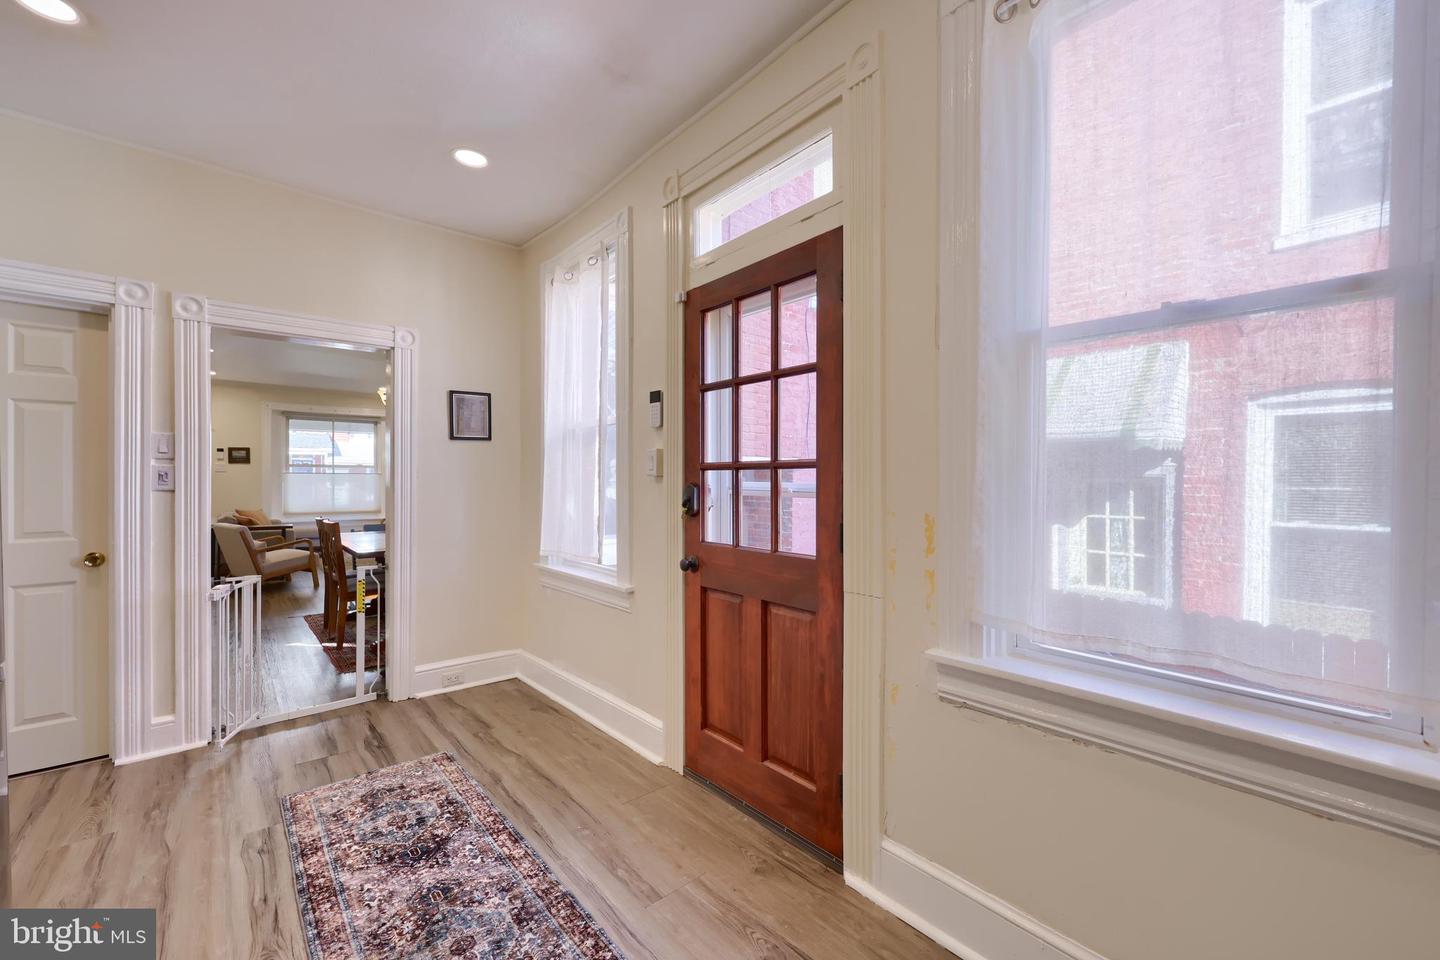
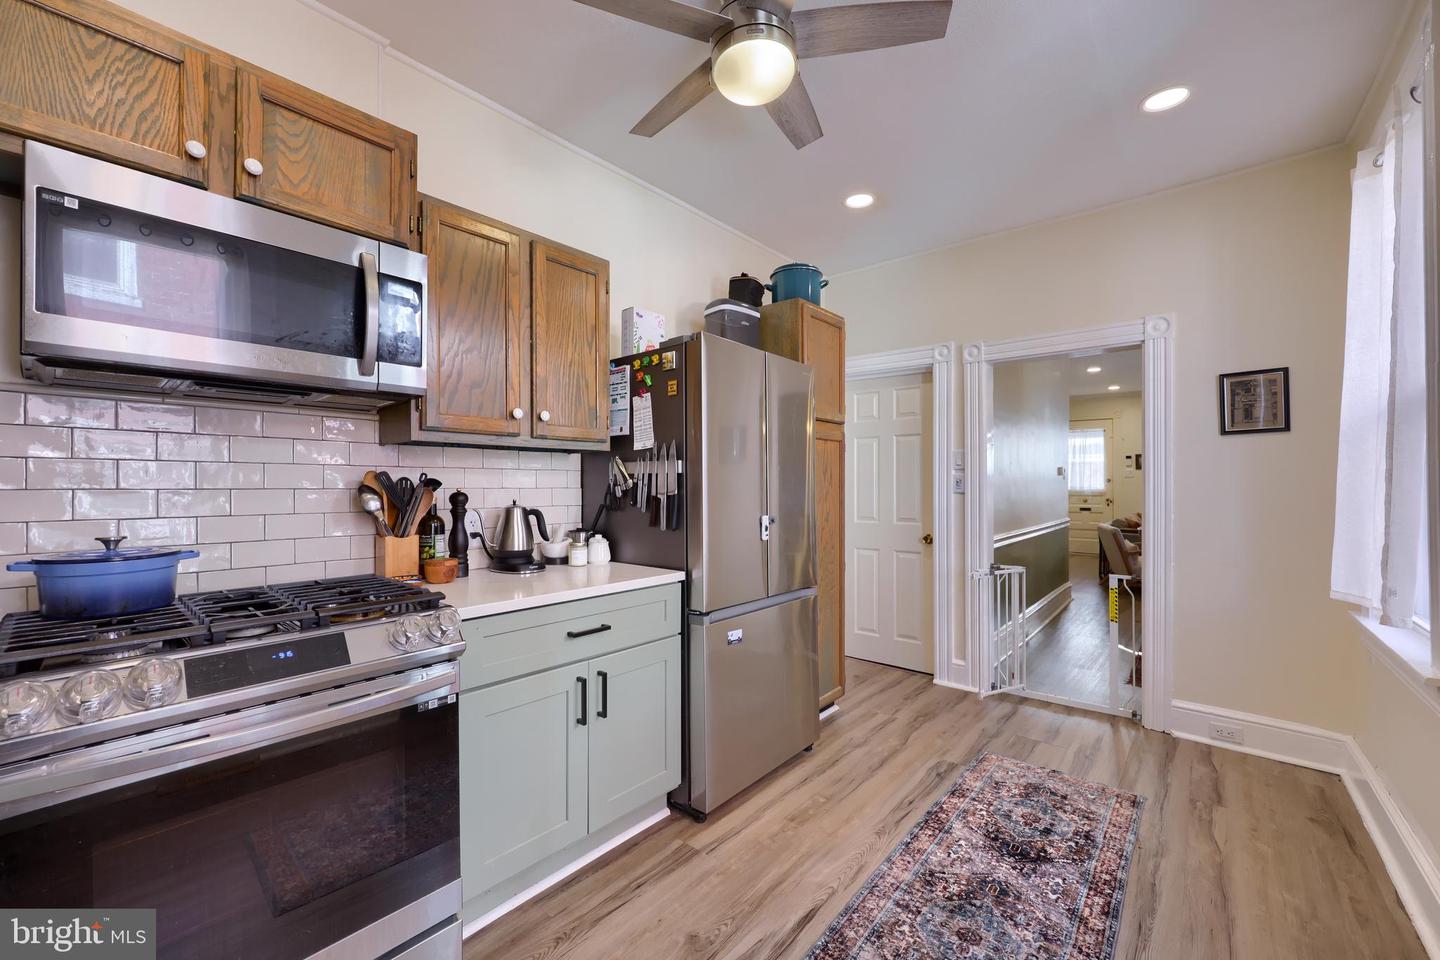
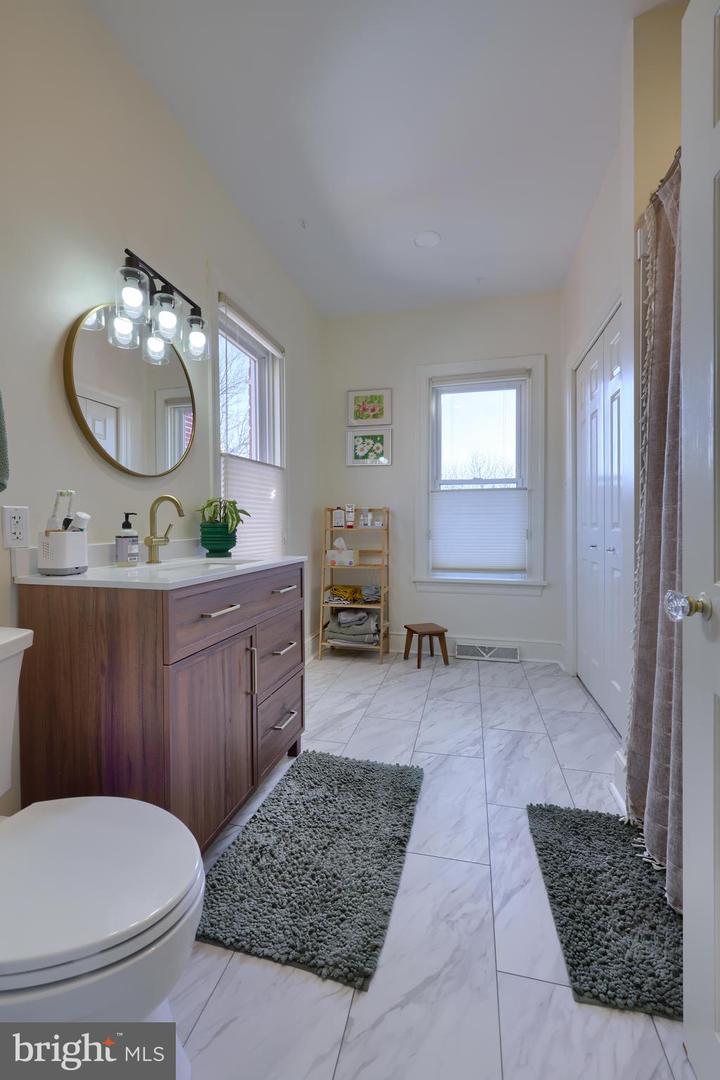
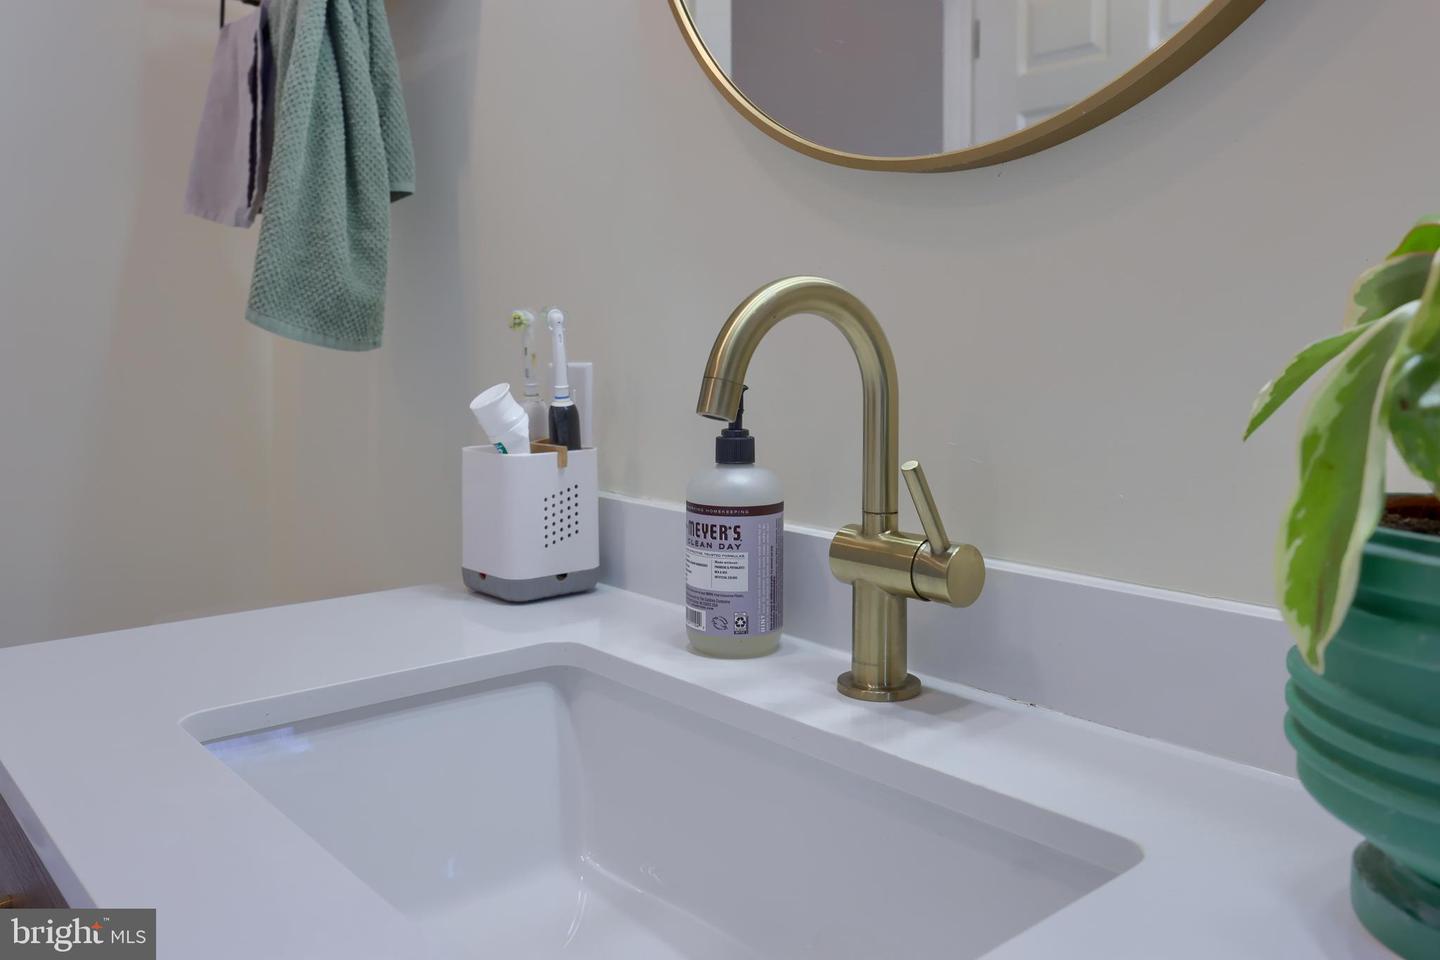
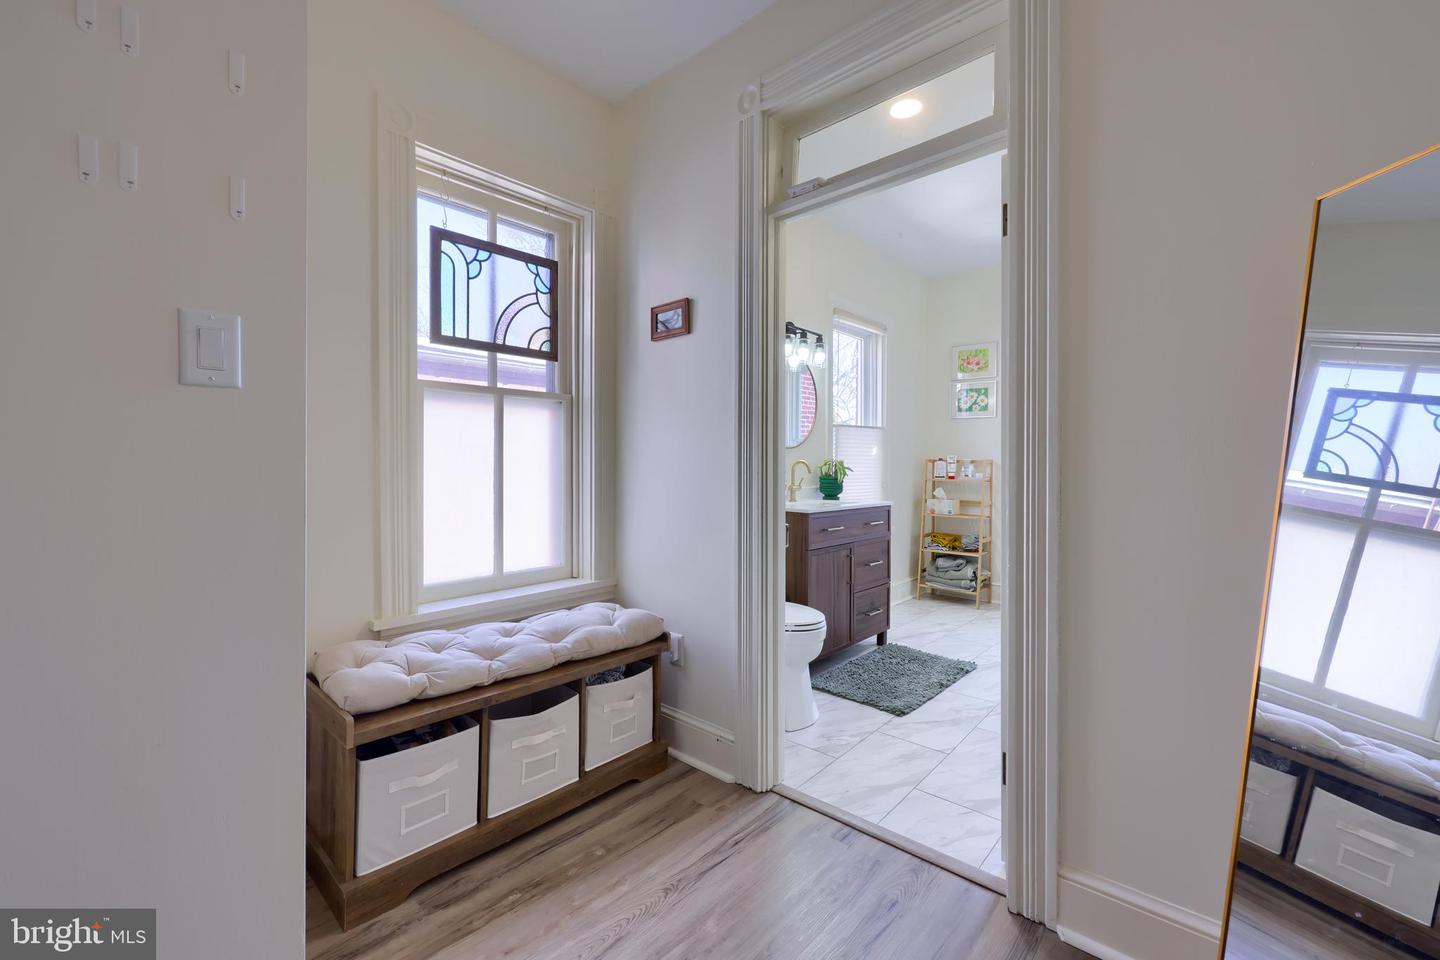
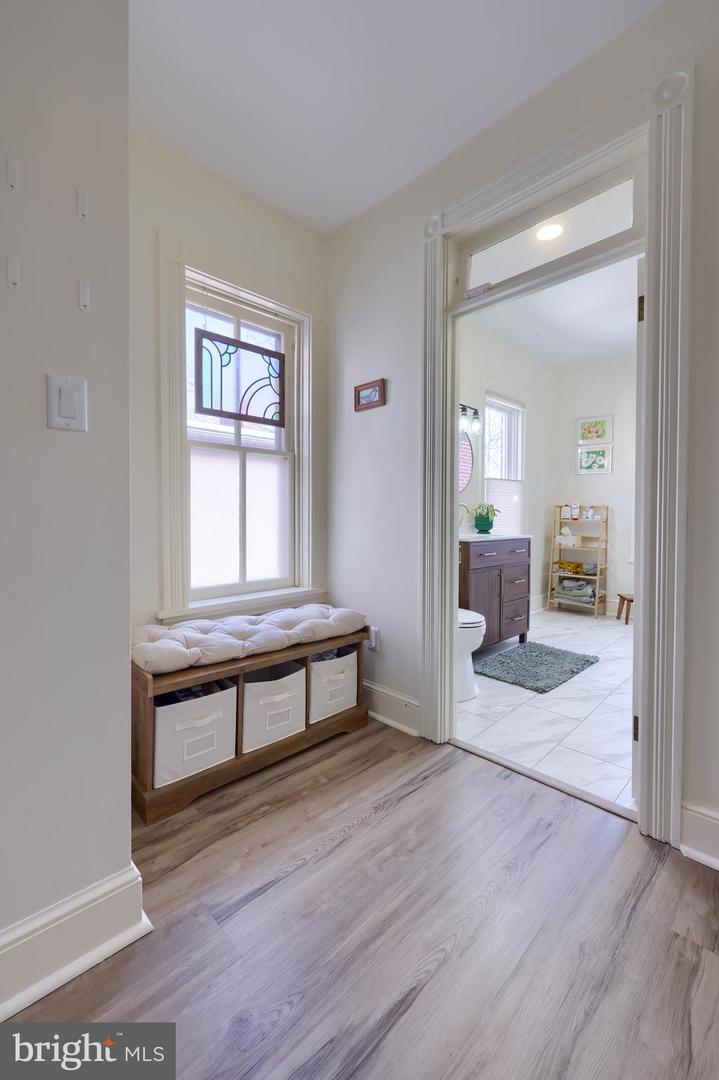
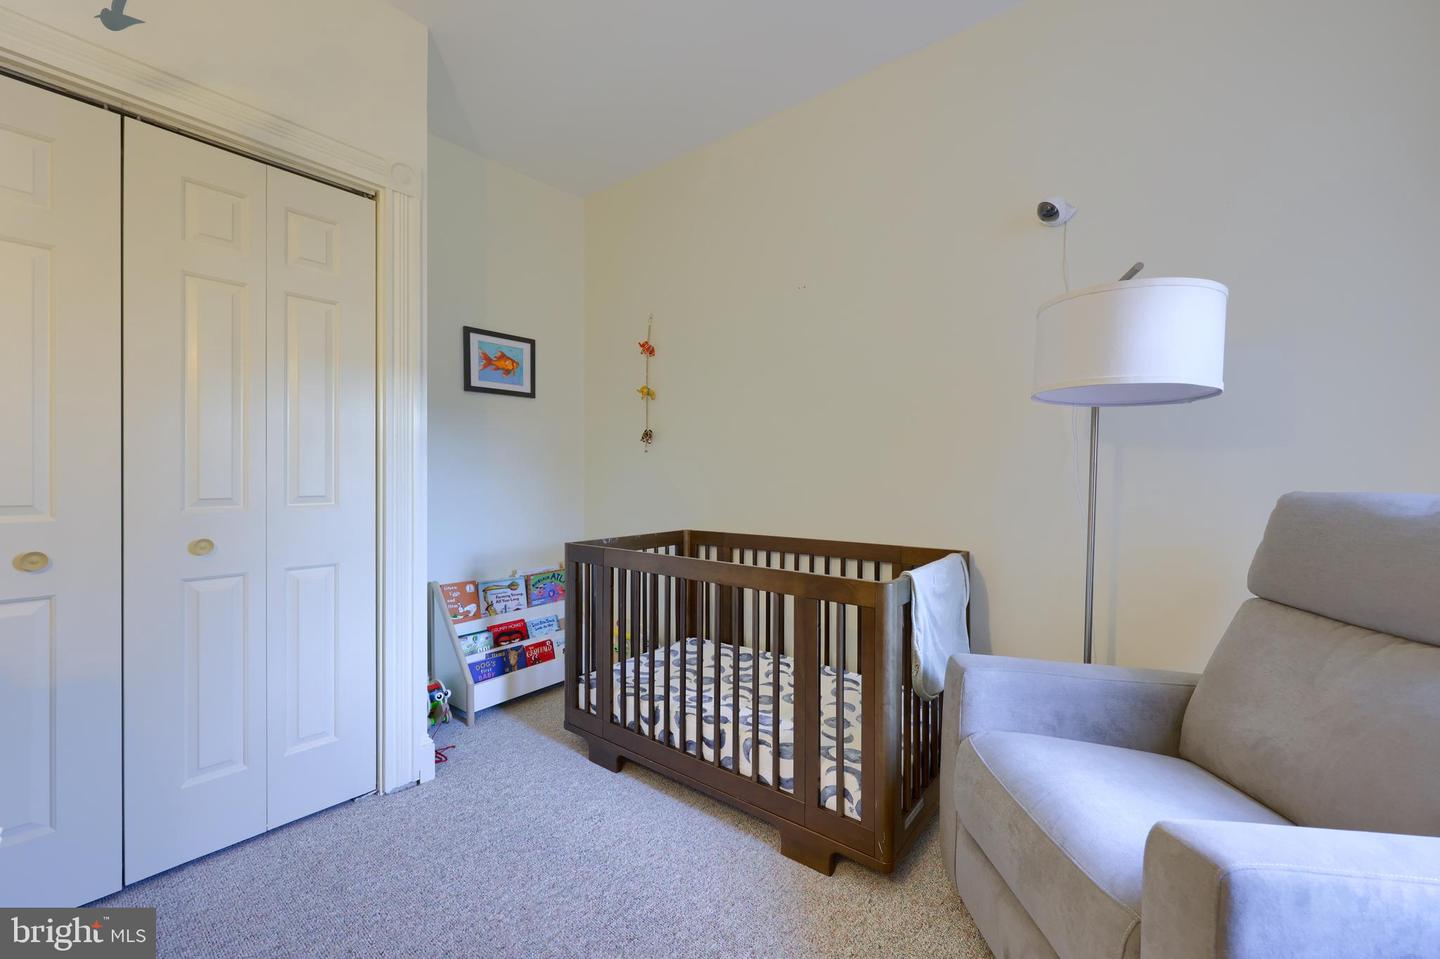
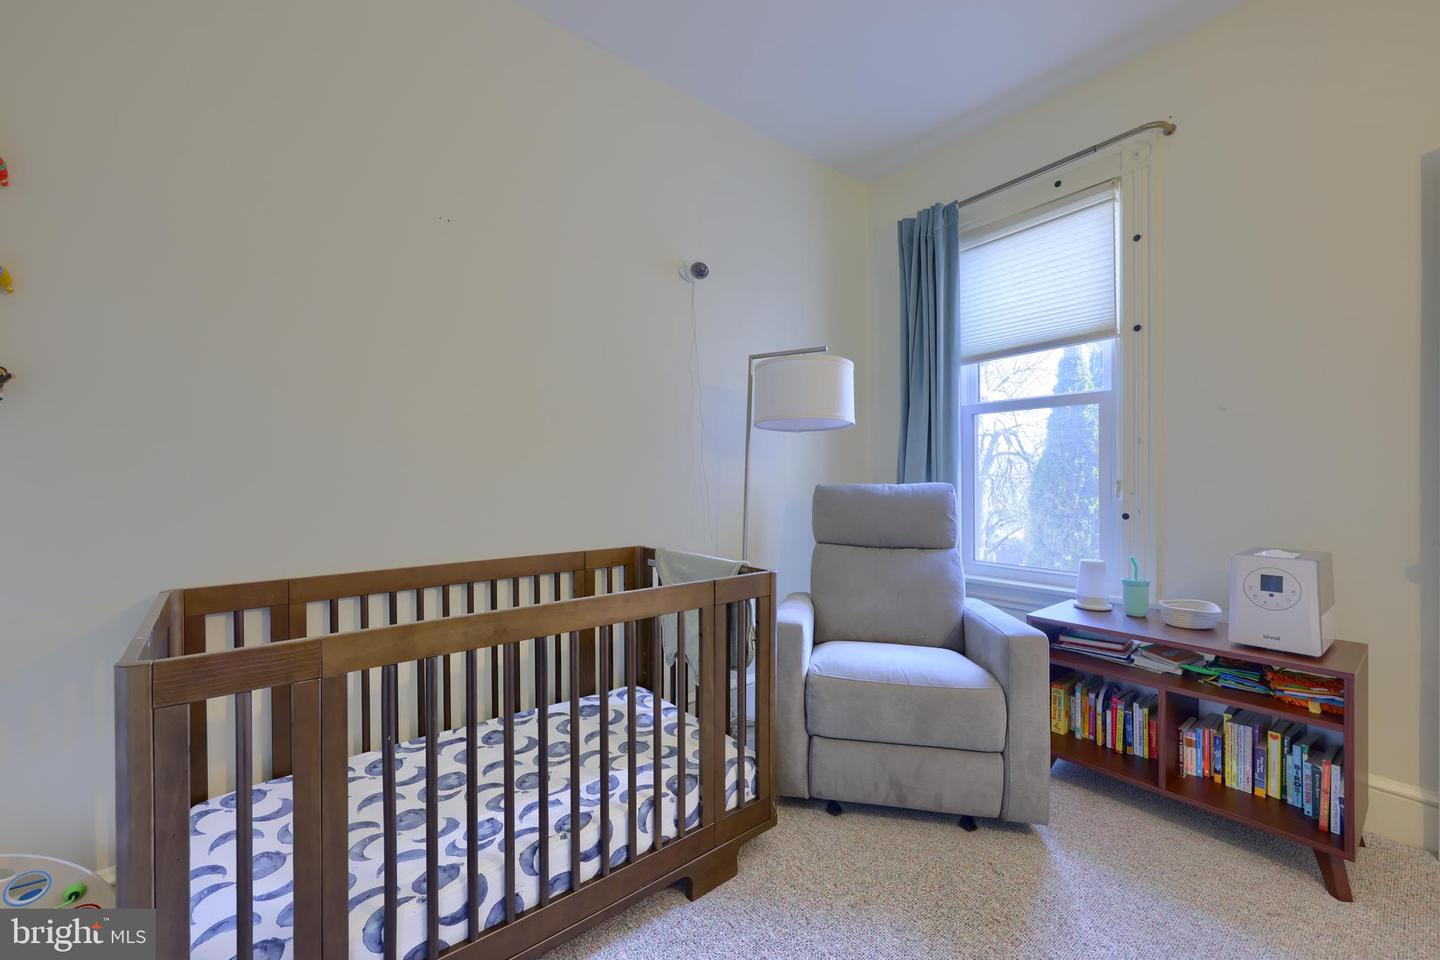
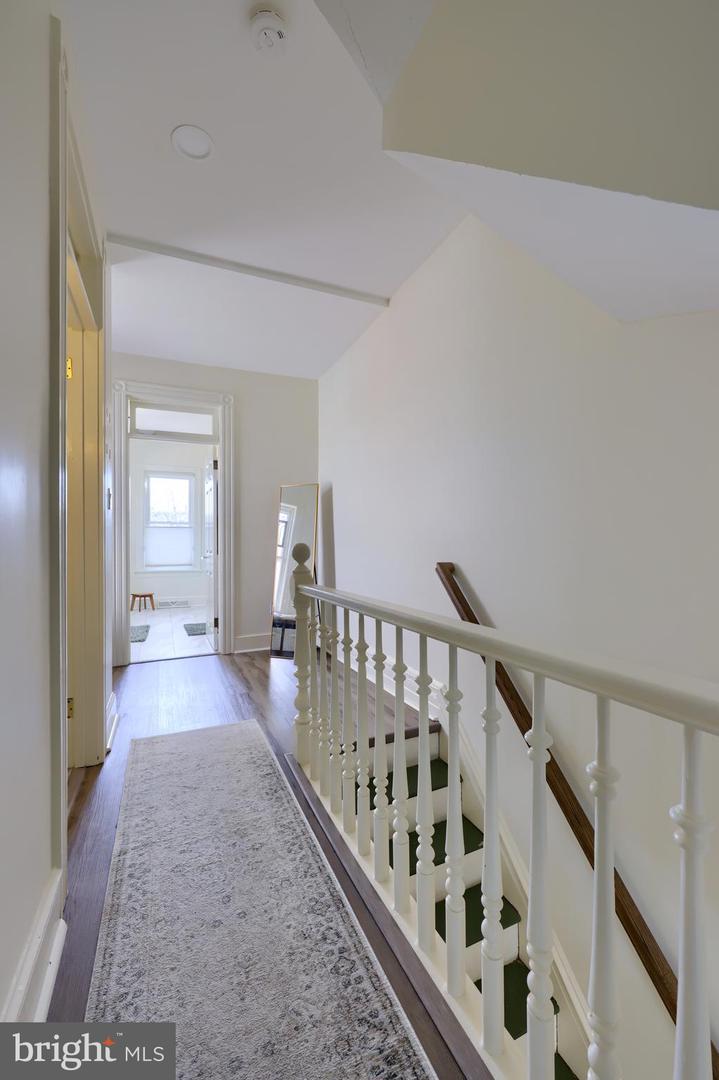
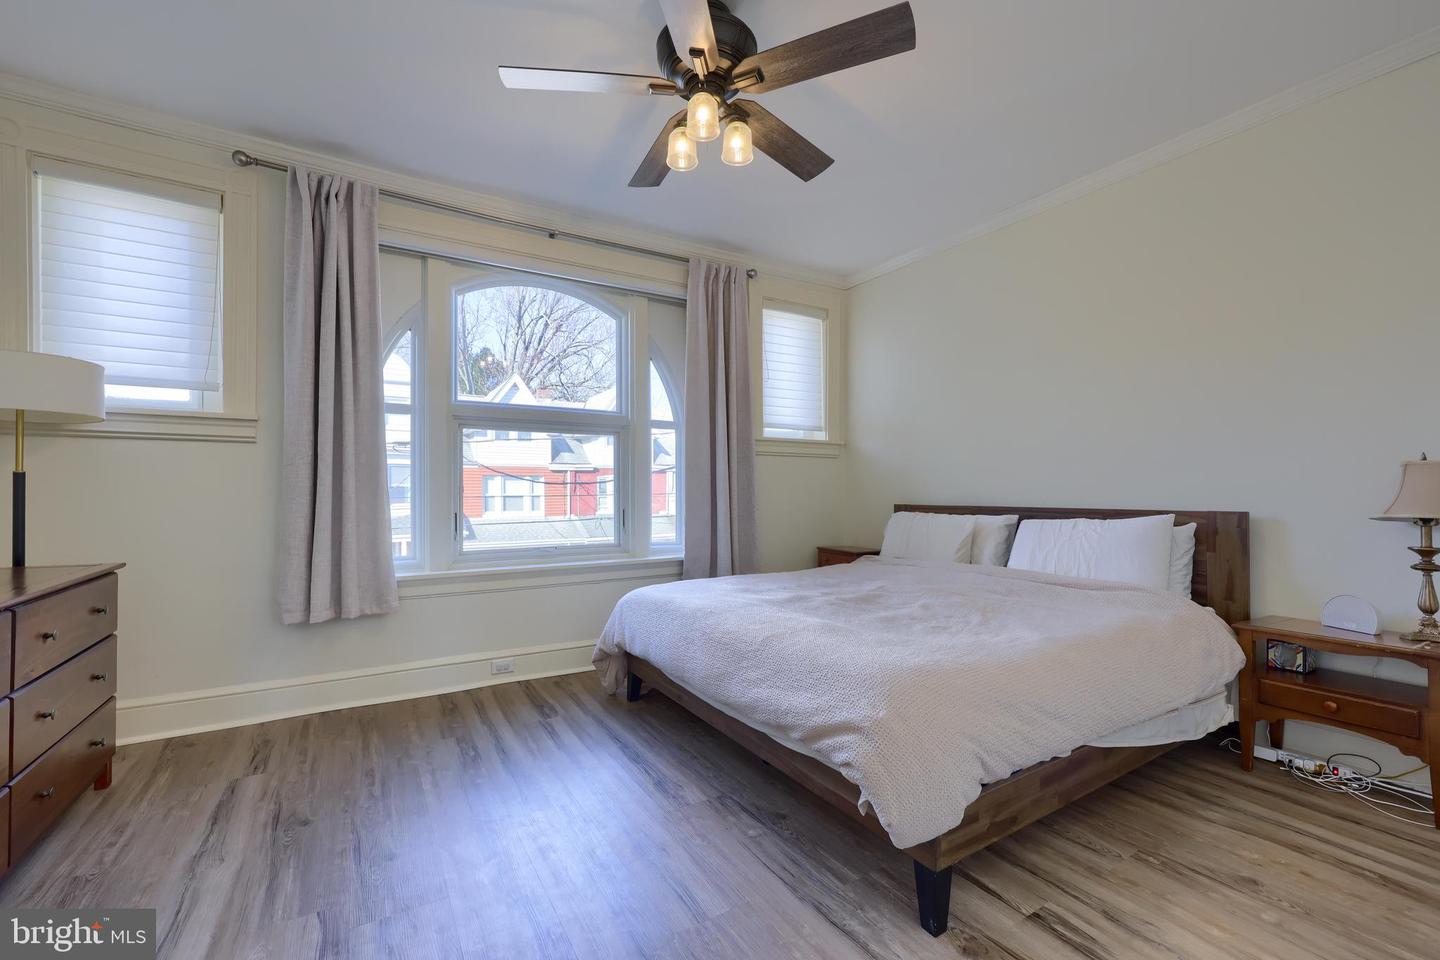
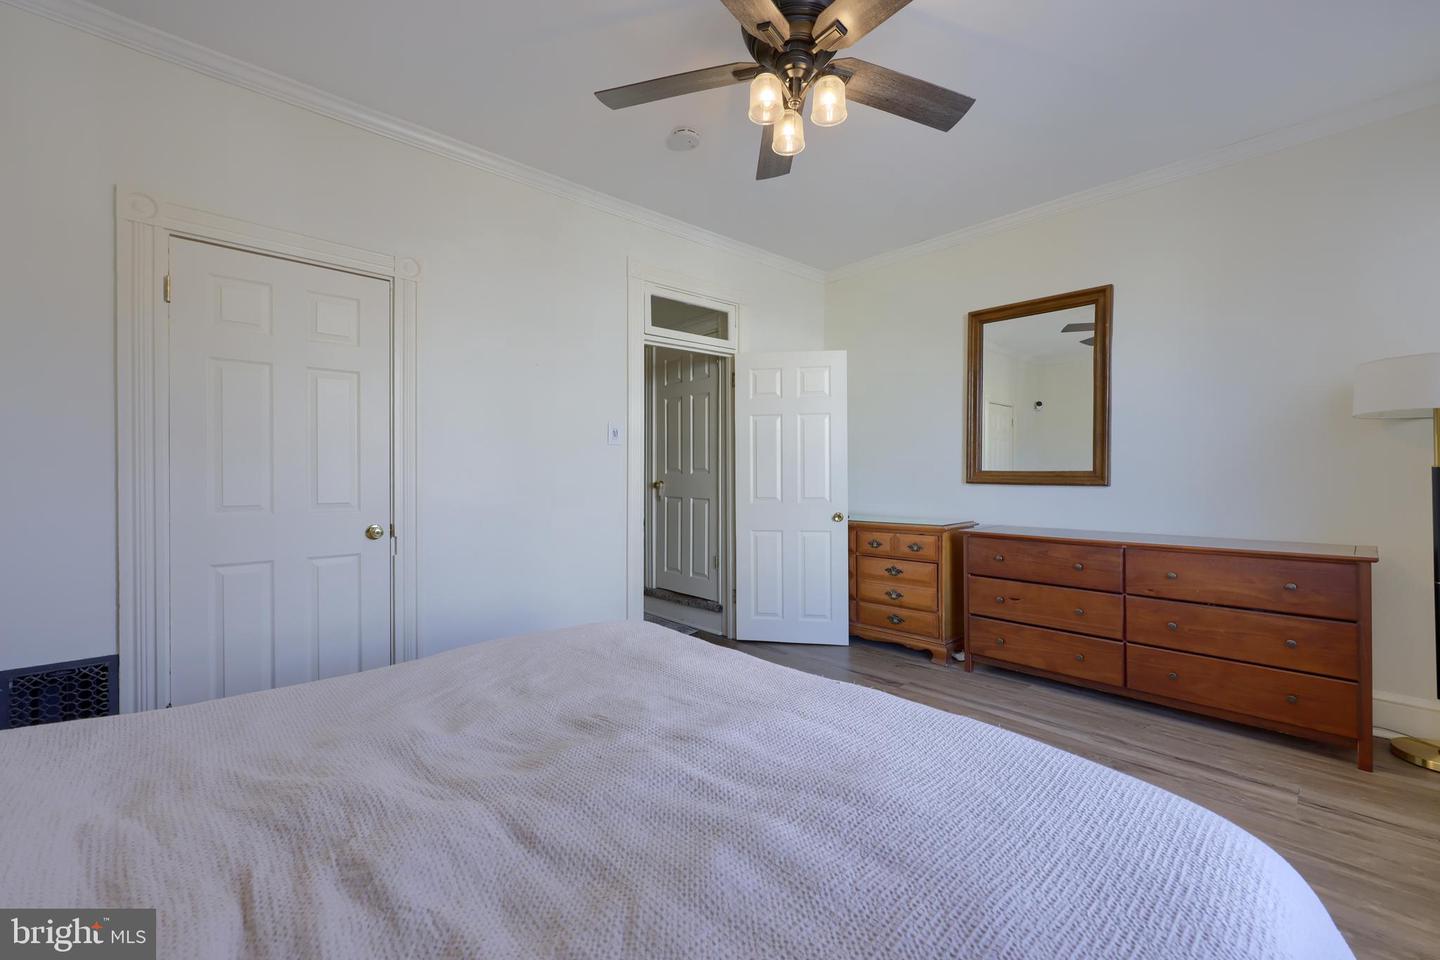
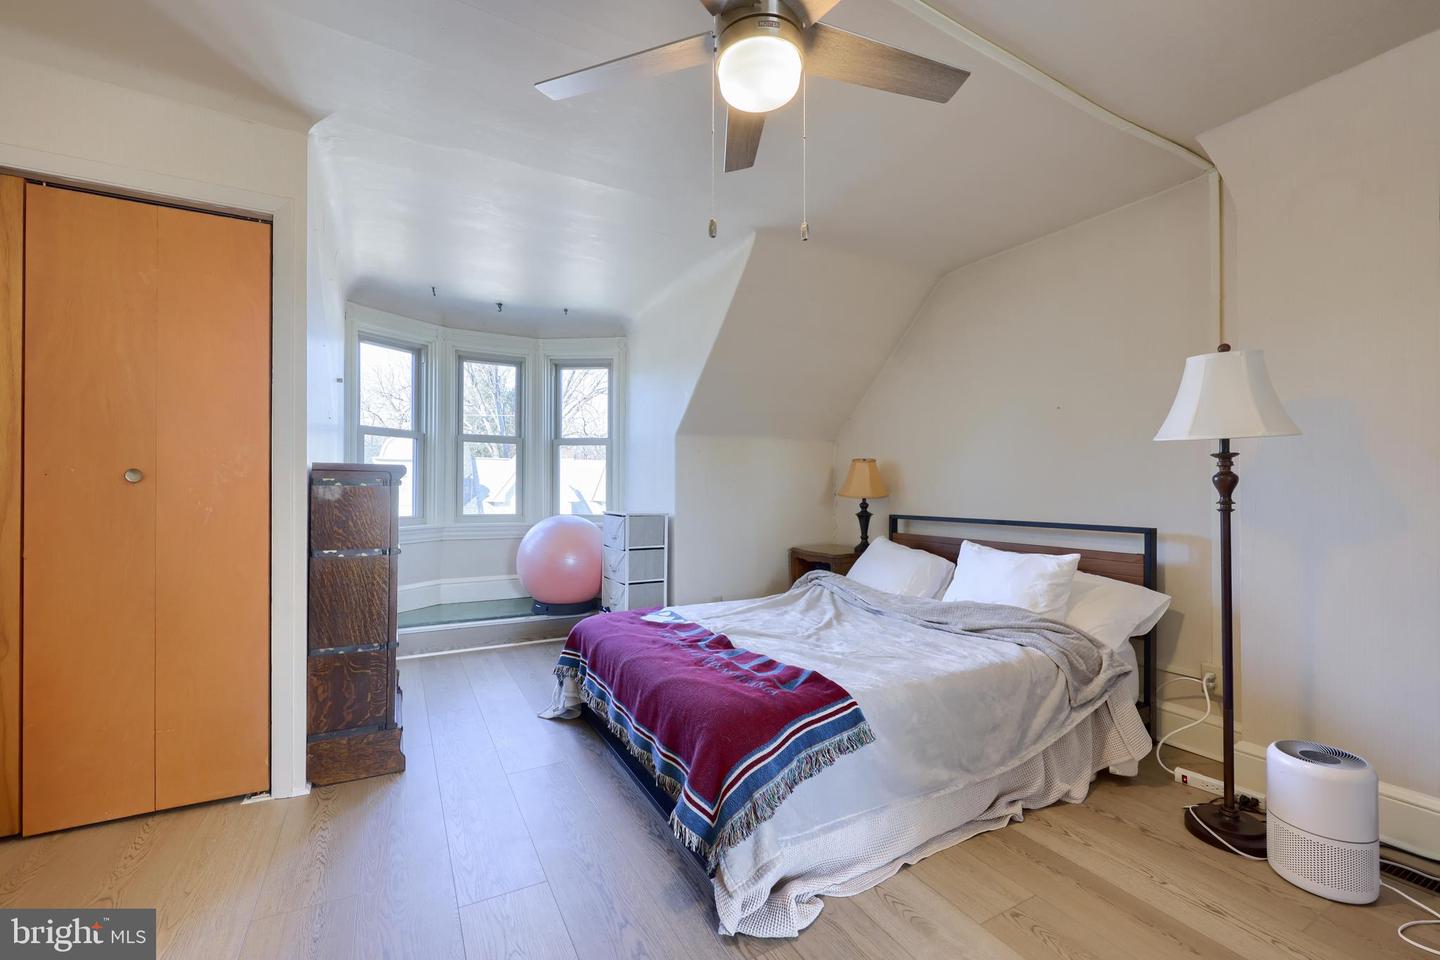
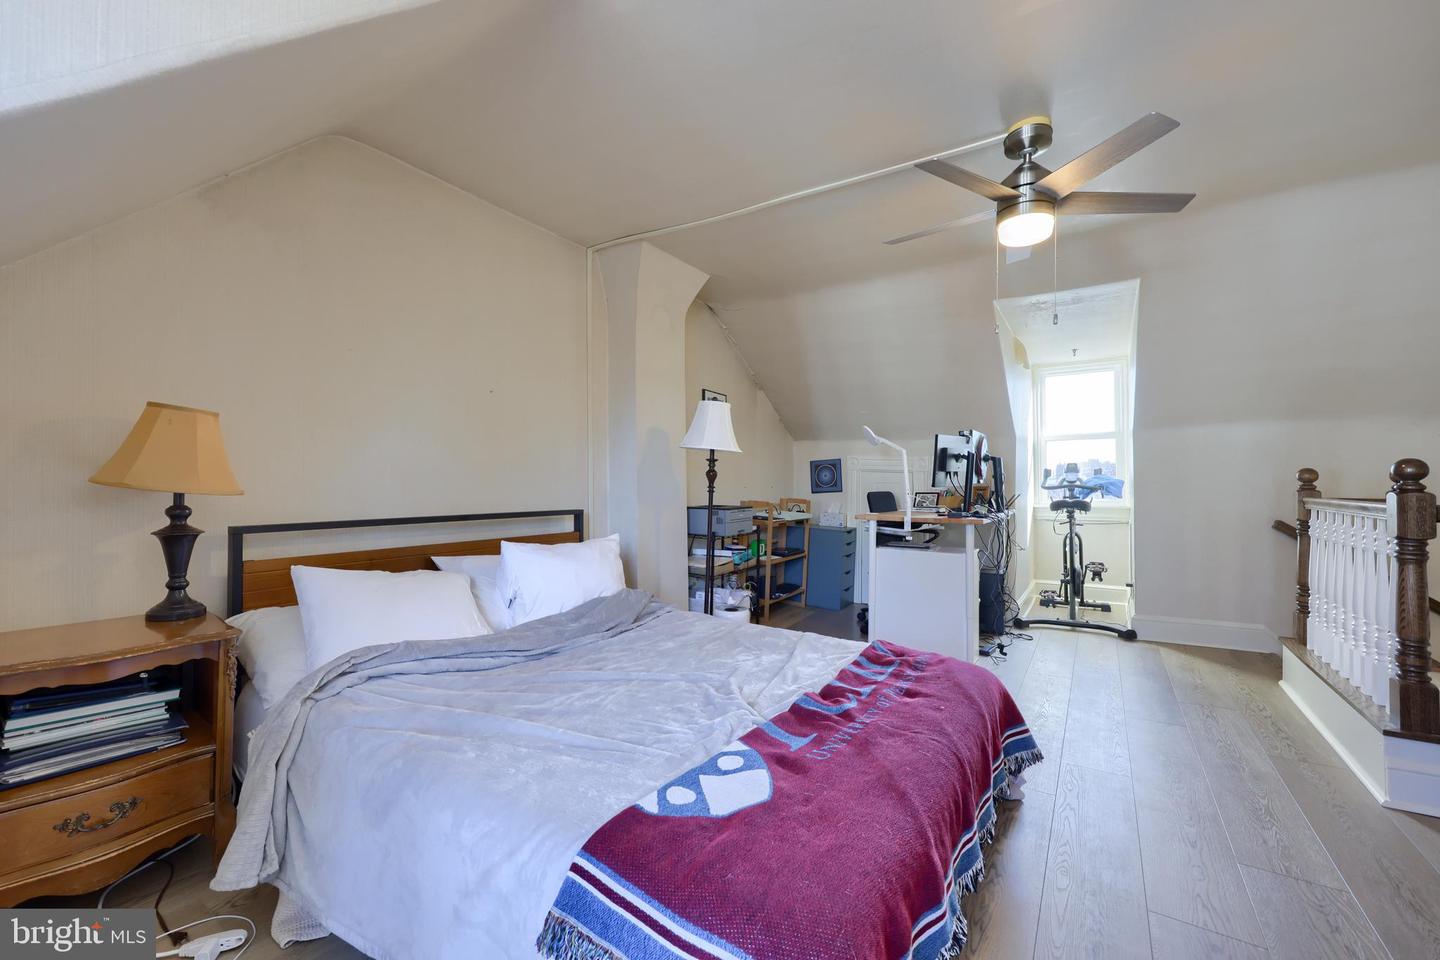
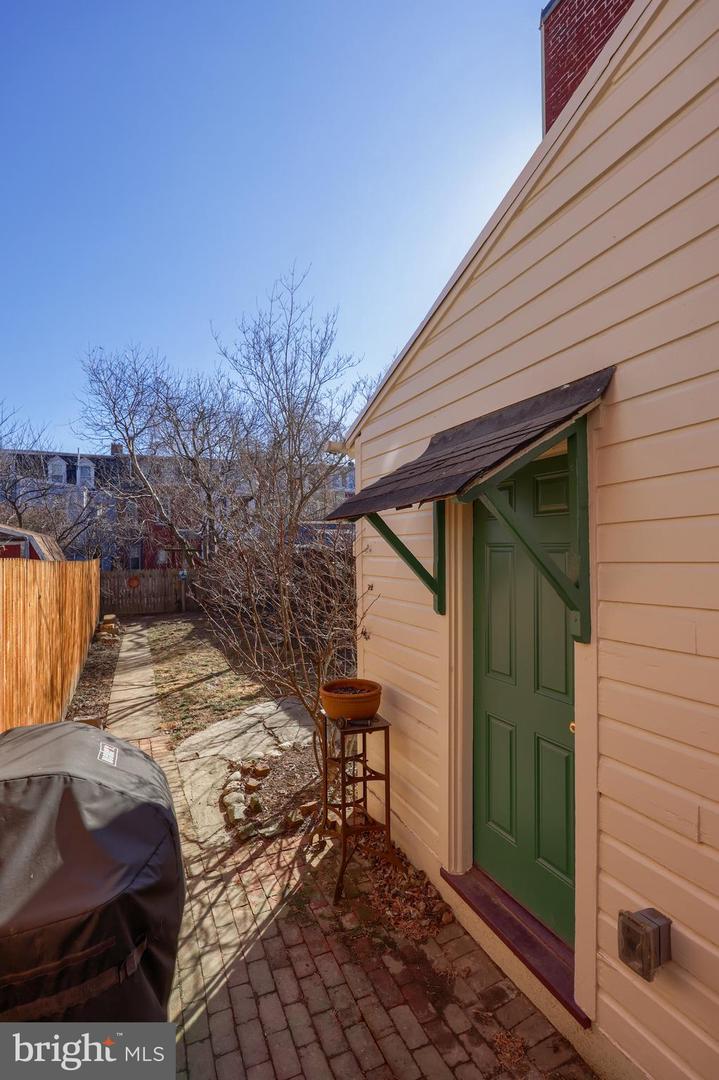
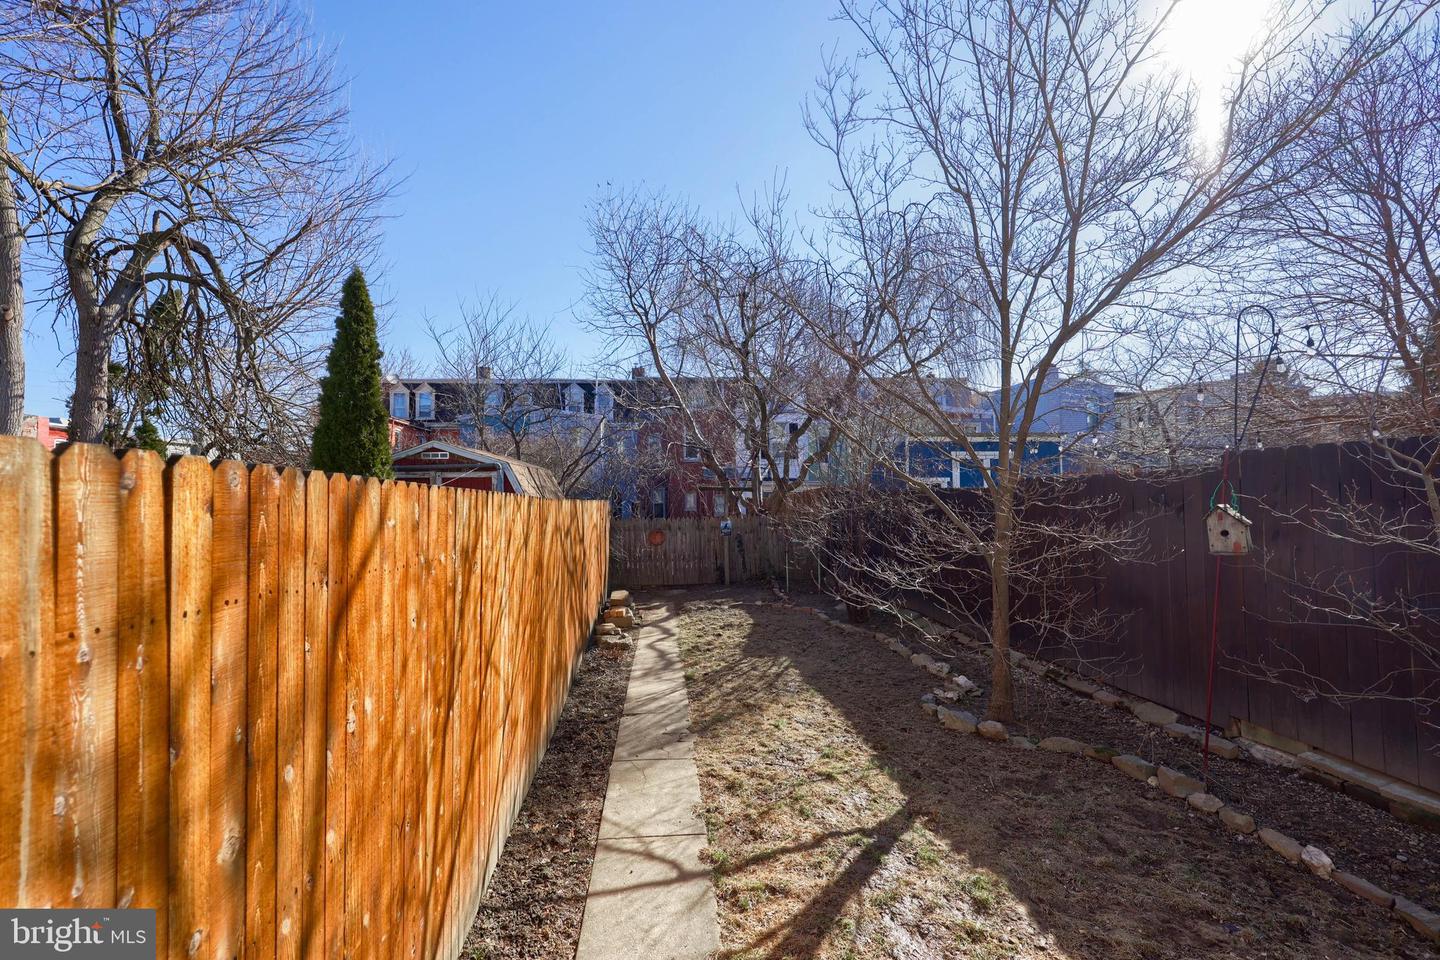
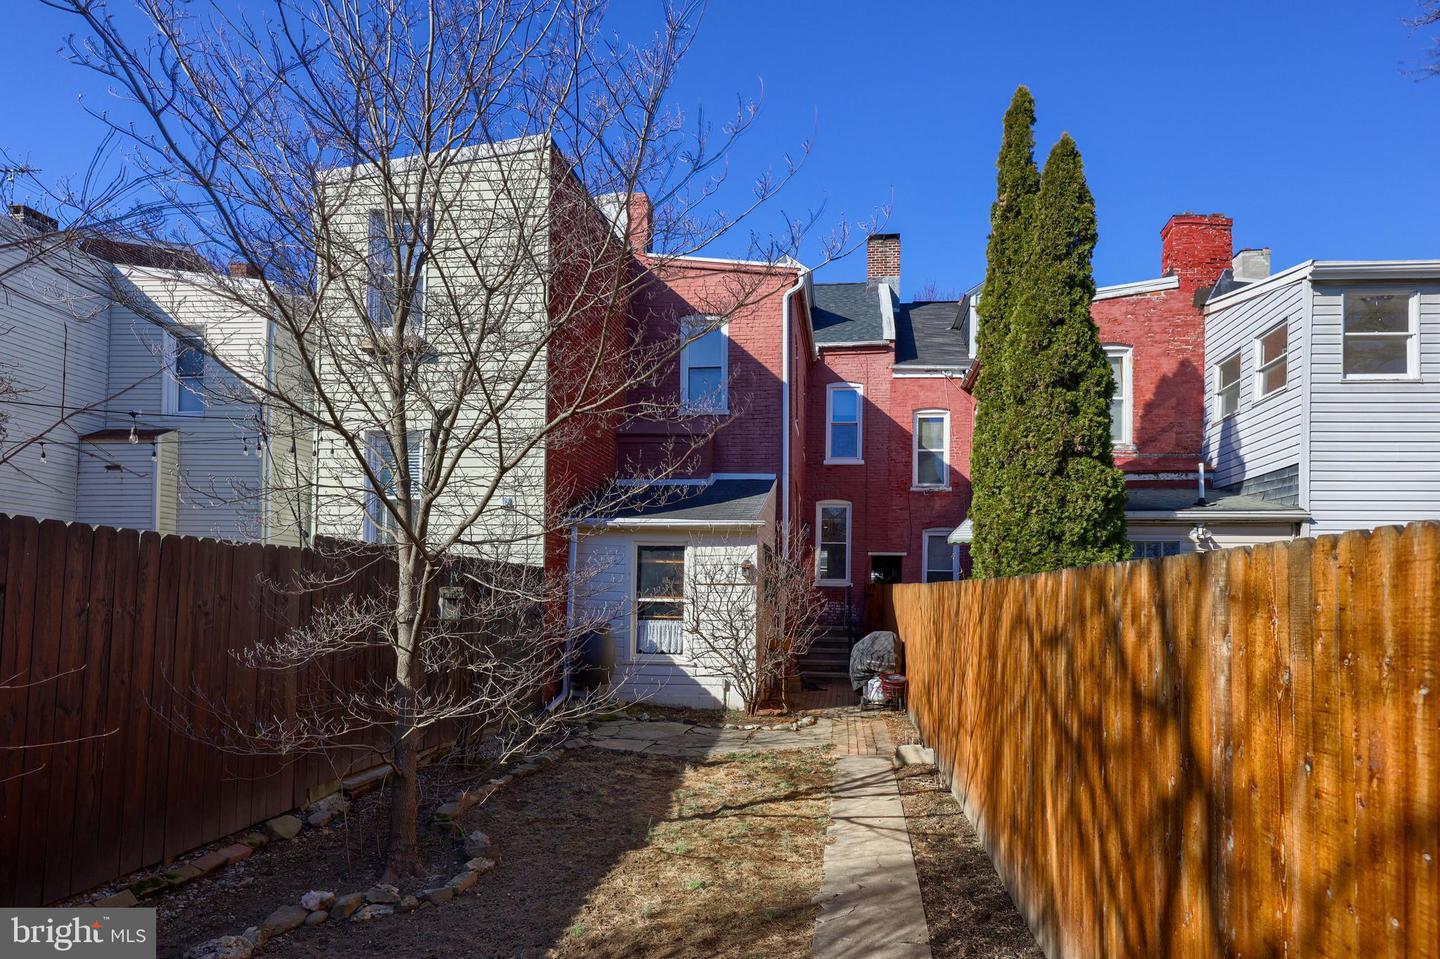
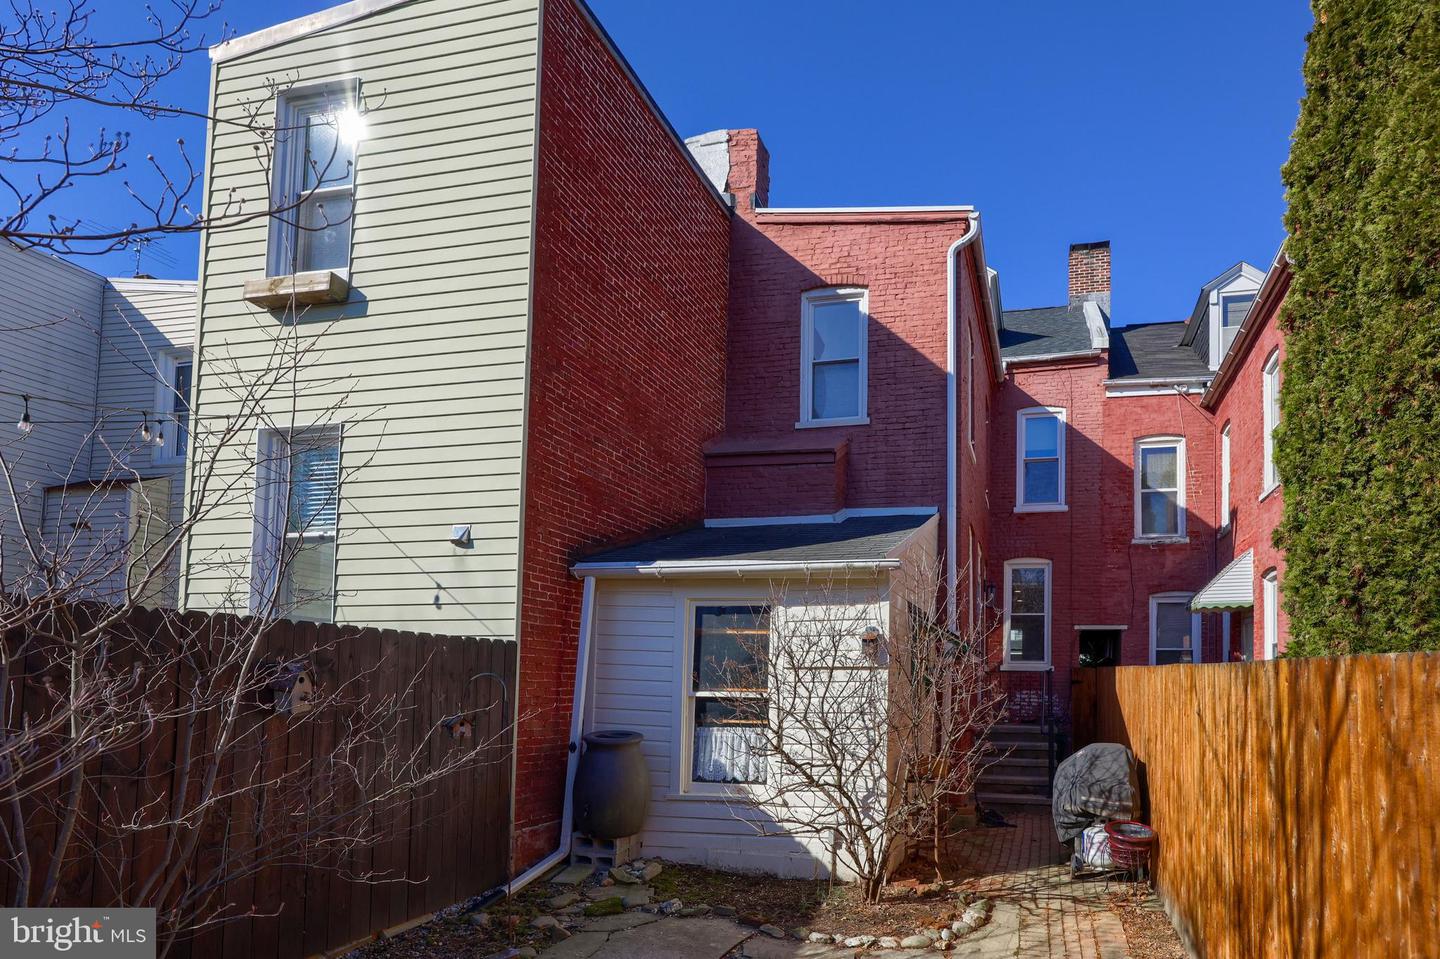
Showings start Saturday, March 15th. Welcome to 539 N Mary Street, nestled in the highly sought-after Chestnut Hill neighborhood of Lancaster City! This charming home blends classic city character with fresh, modern updatesfeaturing brand new luxury vinyl plank flooring throughout, replacement windows, a new kitchen countertop, and an updated full bathroom. With generous ceiling height on every floorincluding the finished atticyoull love the spacious feel throughout. Tucked away on a peaceful street, yet just steps from some of Lancasters favorites like LUCA, Franklin & Marshall College, Buchanan Dog Park, Oka Fusion, Splits & Giggles, Cabilar, and more! Picture summer evenings entertaining in your private backyard. Dont miss your chance to own a piece of this vibrant neighborhoodschedule your showing today!
Interior Details
1493
3
1
Has Heating:
Yes
Heating Type:
Yes
Has Cooling:
Yes
Cooling Type:
Central
Has Fuel:
Yes
Fuel Type:
Gas
Has Basement:
No
Basement Type:
Basement (unspecified)
Has Flooring:
No
Flooring Type:
N/A
Has Fireplace:
Yes
Fireplace Type:
N/A
Property Details
1742
Yes
Yes
Type:
N/A
Location:
N/A
Status:
N/A
Number of Spaces:
N/A
No
No
No
No
No
No
No
Construction Details
Row Home
Brick
N/A
N/A
Composition Shingle
Tax History
Year
Amount
Land
Improvement
Percent Change
Assessment
2021
$4,224
$32,200
$83,600
--%
$115,800
2020
$4,224
$32,200
$83,600
--%
$115,800
2019
$4,161
$32,200
$83,600
--%
$115,800
2018
$4,848
$32,200
$83,600
--%
$115,800
2017
$3,421
$18,100
$56,400
--%
$74,500
2015
$3,310
$18,100
$56,400
--%
$74,500
2014
$3,180
$18,100
$56,400
--%
$74,500
2012
$2,991
$18,100
$56,400
--%
$74,500

Average Home Price in 17603
Nearby Properties
Zip Code
Price
Bed
Bath
Sqft
Lot
Sold Date
$263,699
3 Beds
2 Baths
1,632 Sqft
1,742 Lot (sqft)
Sold 10/14/2026
$248,063
$248,063
3 Beds
1 Baths
1,392 Sqft
1,307 Lot (sqft)
Sold 09/29/2026
$299,837
$299,837
3 Beds
2.5 Baths
1,290 Sqft
871 Lot (sqft)
Sold 09/23/2026
$363,601
3 Beds
1.5 Baths
1,462 Sqft
2,178 Lot (sqft)
Sold 09/23/2026
$297,817
$297,817
3 Beds
1 Baths
1,653 Sqft
2,178 Lot (sqft)
Sold 09/18/2026
$312,878
$312,878
3 Beds
1 Baths
1,320 Sqft
2,614 Lot (sqft)
Sold 09/16/2026
$480,441
$480,441
4 Beds
1 Baths
1,503 Sqft
3,049 Lot (sqft)
Sold 10/26/2026
$372,255
$372,255
4 Beds
2 Baths
1,450 Sqft
1,742 Lot (sqft)
Sold 10/27/2026
$329,900
3 Beds
1.5 Baths
1,282 Sqft
1,742 Lot (sqft)
Sold 10/27/2026
Calculators
Mortgage
Mortgage Calculator
Details for 539 N MARY ST
Property Debt
Foreclosure Contact Details
Similar Homes Nearby


Guides for Mary St

Lincoln, Nebraska’s real estate market has seen steady growth in average property values from March 2023 to February 2024. The market exhibits rising demand and prices, indicating there may be value buys available.