Member Features
Find Real Estate Bargain!
Full foreclosure details
Home value, equity and ownership info
Find homes priced below market
Get full access with a FREE Account
Already a member?
$364,135
Sold Price--beds
--baths
1,741sqft
18,295sqft lot
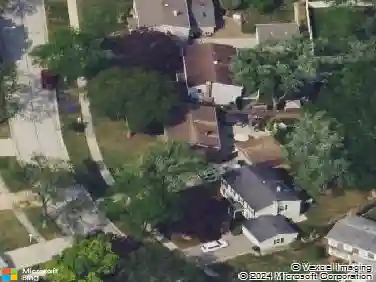
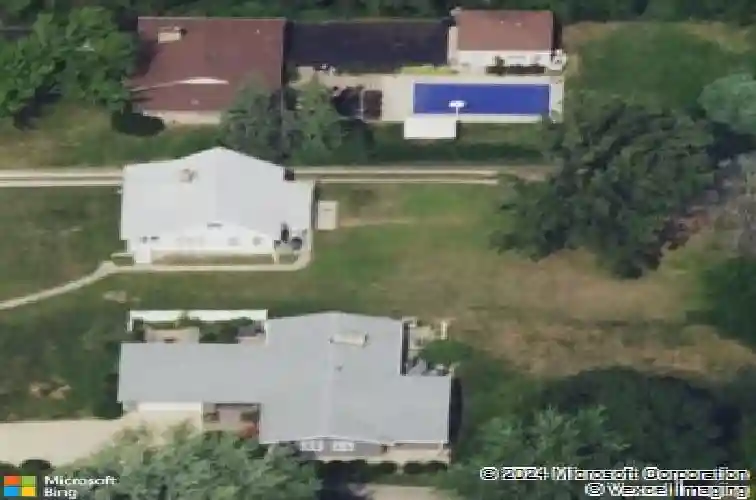
339 N Main St, Lombard, IL 60148
Member Features
Find Real Estate Bargain!
Full foreclosure details
Home value, equity and ownership info
Find homes priced below market
Get full access with a FREE Account
Already a member?
Recently Sold
Off Market
Home type
Price / sqft
Year built
Home Details
Interior Details
1741
N/A
N/A
Has Heating:
No
Heating Type:
N/A
Has Cooling:
No
Cooling Type:
N/A
Has Fuel:
No
Fuel Type:
N/A
Has Basement:
No
Basement Type:
Basement (unspecified)
Has Flooring:
No
Flooring Type:
N/A
Has Fireplace:
Yes
Fireplace Type:
N/A
Property Details
18295
No
No
Type:
N/A
Location:
N/A
Status:
N/A
Number of Spaces:
N/A
N/A
N/A
N/A
N/A
N/A
N/A
N/A
Construction Details
N/A
Aluminum/vinyl
N/A
N/A
N/A
Tax History
Year
Amount
Land
Improvement
Percent Change
Assessment
2019
$2,917
$24,860
$74,040
--%
$98,900
2018
$3,035
$22,410
$66,750
--%
$89,160
2017
$3,105
$43,030
$28,770
--%
$71,800
2016
$3,221
$40,540
$27,100
--%
$67,640
2015
$3,285
$37,770
$25,250
--%
$63,020
2013
$3,282
$46,810
$14,870
--%
$61,680
2012
$3,101
$49,890
$15,850
--%
$65,740
2011
$2,763
$53,630
$17,750
--%
$71,380

Average Home Price in 60148
Nearby Properties
Zip Code
Price
Bed
Bath
Sqft
Lot
Sold Date
$423,053
$423,053
-- Beds
-- Baths
1,707 Sqft
8,712 Lot (sqft)
Sold 09/23/2026
$364,135
$364,135
-- Beds
-- Baths
1,741 Sqft
18,295 Lot (sqft)
Sold 07/13/2026
$525,841
$525,841
-- Beds
-- Baths
1,524 Sqft
8,276 Lot (sqft)
Sold 05/29/2026
$460,642
$460,642
-- Beds
-- Baths
1,741 Sqft
8,712 Lot (sqft)
Sold 05/21/2026
$452,681
$452,681
-- Beds
-- Baths
1,677 Sqft
11,326 Lot (sqft)
Sold 10/13/2026
$449,000
$449,000
-- Beds
-- Baths
1,578 Sqft
6,970 Lot (sqft)
Sold 10/18/2026
$463,795
$463,795
-- Beds
-- Baths
1,633 Sqft
5,663 Lot (sqft)
Sold 10/13/2026