Member Features
Find Real Estate Bargain!
Full foreclosure details
Home value, equity and ownership info
Find homes priced below market
Get full access with a FREE Account
Already a member?
$349,900
Listing Price3beds
1baths
1,096sqft
6,100sqft lot
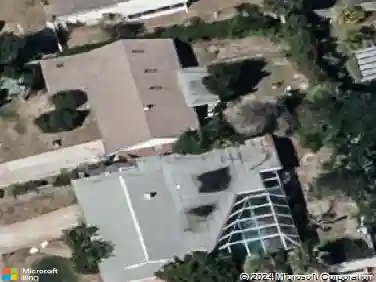
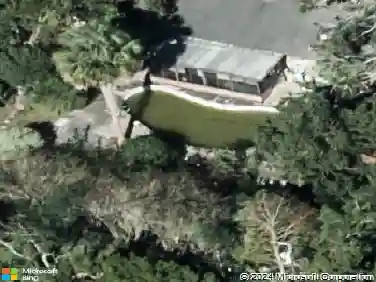
111 Lynnhurst Dr, Ormond Beach, FL 32176
Member Features
Find Real Estate Bargain!
Full foreclosure details
Home value, equity and ownership info
Find homes priced below market
Get full access with a FREE Account
Already a member?
For Sale
Off Market
Home type
Price / sqft
Year built
Home Details
One or more photo(s) has been virtually staged. Welcome to this exquisitely renovated block home perfectly located between the river and the ocean offering you the best of both worlds! The new owners will enjoy peace of mind with a new kitchen that boasts granite countertops, exclusive backsplash, stainless steel appliances, brand new impact windows, open floor plan, specious dining and living rooms, large storage space and more. Throughout the home, you'll also enjoy new luxury vinyl flooring. Save big on home insurance with the brand new roof, HVAC system, and water heater - WOW! Enjoy your comfortable backyard with plenty of space for entertaining! Conveniently located just walking distance from public beach access, riverside parks, shopping and dining. Did we mention No HOA? Dont miss your chance to experience coastal living at its finest! Schedule your showing appointment today!
Interior Details
1096
3
1
Has Heating:
Yes
Heating Type:
Forced Air With Air Conditioning
Has Cooling:
Yes
Cooling Type:
Central
Has Fuel:
Yes
Fuel Type:
Electric
Has Basement:
No
Basement Type:
N/A
Has Flooring:
No
Flooring Type:
Combination, Other
Has Fireplace:
Yes
Fireplace Type:
N/A
Property Details
6100
No
No
Type:
Garage, Attached
Location:
N/A
Status:
N/A
Number of Spaces:
1
No
No
No
No
Yes
No
No
Construction Details
N/A
Concrete Block
N/A
Gable
Asphalt
Tax History
Year
Amount
Land
Improvement
Percent Change
Assessment
2020
$3,545
$48,800
$115,193
--%
$163,993
2019
$3,585
$48,800
$114,495
--%
$163,295
2018
$3,499
$0
$0
--%
$154,418
2017
$3,275
$46,970
$100,748
--%
$147,718
2016
$3,063
$44,225
$87,833
--%
$132,058
2014
$2,617
$0
$0
--%
$106,957
2013
$2,399
$0
$0
--%
$95,881
2011
$2,382
$0
$0
--%
$91,976

Average Home Price in 32176
Nearby Properties
Zip Code
Price
Bed
Bath
Sqft
Lot
Sold Date
$377,749
2 Beds
1 Baths
1,060 Sqft
8,450 Lot (sqft)
Sold 10/07/2026
$285,747
2 Beds
1 Baths
936 Sqft
7,006 Lot (sqft)
Sold 09/10/2026
$336,405
2 Beds
1 Baths
1,154 Sqft
7,006 Lot (sqft)
Sold 07/31/2026
$406,478
3 Beds
2 Baths
1,175 Sqft
6,441 Lot (sqft)
Sold 07/09/2026
$435,653
3 Beds
2 Baths
955 Sqft
7,006 Lot (sqft)
Sold 06/05/2026
$300,000
2 Beds
2 Baths
978 Sqft
7,006 Lot (sqft)
Sold 10/13/2026
$439,000
$439,000
2 Beds
2 Baths
940 Sqft
7,006 Lot (sqft)
Sold 09/29/2026
$287,000
2 Beds
1 Baths
955 Sqft
6,138 Lot (sqft)
Sold 10/13/2026
$359,900
$359,900
2 Beds
1 Baths
1,118 Sqft
6,000 Lot (sqft)
Sold 10/18/2026