Member Features
Find Real Estate Bargain!
Full foreclosure details
Home value, equity and ownership info
Find homes priced below market
Get full access with a FREE Account
Already a member?
$445,144
Sold Price4beds
1.75baths
1,860sqft
7,841sqft lot
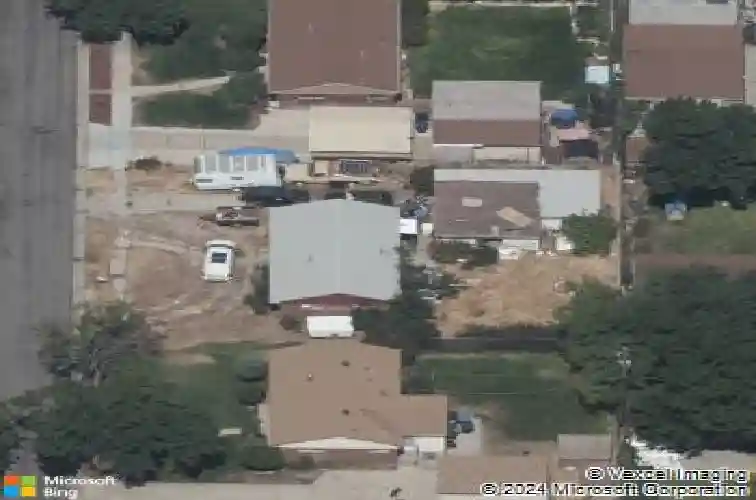
3455 S Lynnbrook Dr, Magna, UT 84044
Member Features
Find Real Estate Bargain!
Full foreclosure details
Home value, equity and ownership info
Find homes priced below market
Get full access with a FREE Account
Already a member?
Recently Sold
Off Market
Home type
Price / sqft
Year built
Home Details
Interior Details
1860
4
1.75
Has Heating:
Yes
Heating Type:
Central
Has Cooling:
Yes
Cooling Type:
None
Has Fuel:
No
Fuel Type:
N/A
Has Basement:
No
Basement Type:
Partial
Has Flooring:
No
Flooring Type:
N/A
Has Fireplace:
Yes
Fireplace Type:
N/A
Property Details
7841
Yes
Yes
Type:
Driveway Concrete
Location:
N/A
Status:
N/A
Number of Spaces:
0
No
No
No
No
No
No
No
Construction Details
Ranch
Brick
N/A
N/A
Asphalt
Tax History
Year
Amount
Land
Improvement
Percent Change
Assessment
2020
$2,193
$0
$0
--%
$126,720
2019
$2,178
$0
$0
--%
$124,465
2017
$1,869
$57,900
$151,500
--%
$209,400
2017
$1,869
$57,900
$121,300
--%
$179,200
2015
$52
$57,900
$99,500
--%
$157,400
2014
$1,479
$0
$0
--%
$138,800
2013
$35
$0
$0
--%
$131,200
2012
$1,689
$0
$0
--%
$131,200

Average Home Price in 84044
Nearby Properties
Zip Code
Price
Bed
Bath
Sqft
Lot
Sold Date
$439,053
$439,053
6 Beds
1 Baths
1,752 Sqft
6,098 Lot (sqft)
Sold 10/26/2026
$439,149
$439,149
5 Beds
2 Baths
1,822 Sqft
6,534 Lot (sqft)
Sold 10/13/2026
$446,235
$446,235
5 Beds
2 Baths
1,782 Sqft
6,970 Lot (sqft)
Sold 10/27/2026
$440,000
$440,000
5 Beds
2 Baths
1,792 Sqft
6,098 Lot (sqft)
Sold 10/27/2026
$484,035
$484,035
5 Beds
2 Baths
2,005 Sqft
6,970 Lot (sqft)
Sold 10/27/2026
Calculators
Mortgage
Mortgage Calculator
Details for 3455 S LYNNBROOK DR
Property Debt
Foreclosure Contact Details
Similar Homes Nearby

Guides for Lynnbrook Dr

The Salt Lake City real estate market is experiencing significant shifts, as average property values have dropped citywide. However, neighbourhood trends vary, with West Valley City seeing a slight rise in property values, while others like North Salt Lake show a decline. This fluctuation highlights the importance of localized analysis in real estate investment.