Member Features
Find Real Estate Bargain!
Full foreclosure details
Home value, equity and ownership info
Find homes priced below market
Get full access with a FREE Account
Already a member?
$453,045
Sold Price--beds
2baths
2,150sqft
9,742sqft lot
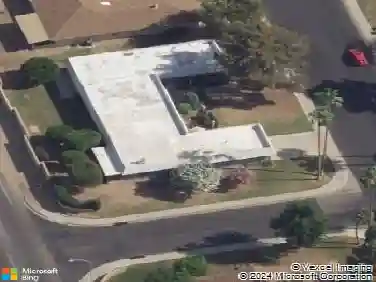
17619 N Lindgren Ave, Sun City, AZ 85373
Member Features
Find Real Estate Bargain!
Full foreclosure details
Home value, equity and ownership info
Find homes priced below market
Get full access with a FREE Account
Already a member?
Recently Sold
Off Market
Home type
Price / sqft
Year built
Home Details
Interior Details
2150
N/A
2
Has Heating:
Yes
Heating Type:
Forced Air With Air Conditioning
Has Cooling:
Yes
Cooling Type:
Refrigerator
Has Fuel:
No
Fuel Type:
N/A
Has Basement:
No
Basement Type:
N/A
Has Flooring:
No
Flooring Type:
N/A
Has Fireplace:
Yes
Fireplace Type:
N/A
Property Details
9742
No
No
Type:
N/A
Location:
N/A
Status:
N/A
Number of Spaces:
N/A
No
No
No
No
No
No
No
Construction Details
N/A
Wood
N/A
N/A
Tile
Tax History
Year
Amount
Land
Improvement
Percent Change
Assessment
2020
$2,032
$4,910
$19,650
--%
$24,560
2019
$2,002
$4,910
$19,670
--%
$24,580
2018
$1,925
$4,690
$18,760
--%
$23,450
2017
$1,861
$4,330
$17,350
--%
$21,680
2016
$1,748
$4,040
$16,180
--%
$20,220
2014
$957
$3,280
$13,150
--%
$16,430
2013
$1,448
$2,890
$11,580
--%
$14,470
2012
$1,529
$3,200
$12,810
--%
$16,010

Average Home Price in 85373
Nearby Properties
Zip Code
Price
Bed
Bath
Sqft
Lot
Sold Date
$365,644
$365,644
-- Beds
2 Baths
2,150 Sqft
9,225 Lot (sqft)
Sold 10/20/2026
$370,908
$370,908
2 Beds
2 Baths
2,116 Sqft
8,727 Lot (sqft)
Sold 10/10/2026
$457,049
$457,049
-- Beds
3 Baths
1,919 Sqft
6,462 Lot (sqft)
Sold 10/07/2026
$453,852
-- Beds
2 Baths
2,150 Sqft
9,265 Lot (sqft)
Sold 09/23/2026
$420,643
$420,643
-- Beds
2 Baths
2,150 Sqft
10,016 Lot (sqft)
Sold 09/10/2026
$427,188
$427,188
3 Beds
2 Baths
2,150 Sqft
8,700 Lot (sqft)
Sold 08/26/2026
$376,755
-- Beds
2 Baths
1,999 Sqft
10,216 Lot (sqft)
Sold 08/26/2026
$389,171
$389,171
2 Beds
2 Baths
1,942 Sqft
11,928 Lot (sqft)
Sold 08/11/2026
$357,677
-- Beds
2 Baths
1,934 Sqft
9,225 Lot (sqft)
Sold 07/22/2026