Member Features
Find Real Estate Bargain!
Full foreclosure details
Home value, equity and ownership info
Find homes priced below market
Get full access with a FREE Account
Already a member?
$350,000
Listing Price2beds
2baths
1,447sqft
2,339sqft lot
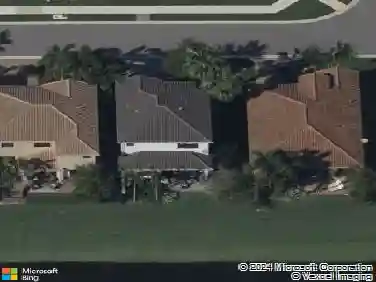
7943 Lake Sands Dr, Delray Beach, FL 33446
Member Features
Find Real Estate Bargain!
Full foreclosure details
Home value, equity and ownership info
Find homes priced below market
Get full access with a FREE Account
Already a member?
For Sale
Off Market
Home type
Price / sqft
Year built
Home Details
Priceless Privacy! Imagine moving into your own private oasis that sits at the quiet end of a cul-de-sac with unmatched lush, colorful surroundings out every window. High ceilings elevate the open layout, maximizing the radiant natural light. A split floor plan offers the perfect balance of connected living and private retreats for your guests. 2 walk-in closets, so much storage in the kitchen. This turnkey sanctuary delivers both a secluded personal haven and an active, connected lifestyle with resort-style amenities. Fun awaits, including premium pickleball and tennis courts, sparkling swimming pools, scenic walking trails, and a vibrant social calendar packed with community clubs and events. Your HOA includes "everything" even alarm systems and 2026 Roof :) Come live the Florida Life! Flooring options are available for the front room and closets. Seller is willing to complete the flooring with carpeting upon buyer request, or the buyer may choose to keep the existing tile. Flooring costs are negotiable, providing flexibility for the buyer to customize the space to their preference.
Interior Details
1447
2
2
Has Heating:
No
Heating Type:
N/A
Has Cooling:
No
Cooling Type:
N/A
Has Fuel:
No
Fuel Type:
N/A
Has Basement:
No
Basement Type:
N/A
Has Flooring:
No
Flooring Type:
N/A
Has Fireplace:
Yes
Fireplace Type:
N/A
Property Details
2339
No
No
Type:
Garage, Attached
Location:
N/A
Status:
N/A
Number of Spaces:
1
No
No
No
No
Yes
No
No
Construction Details
Townhouse
N/A
N/A
N/A
N/A
Tax History
Year
Amount
Land
Improvement
Percent Change
Assessment
2019
$1,140
$0
$0
--%
$100,965
2019
$1,140
$0
$0
--%
$98,695
2018
$1,063
$0
$0
--%
$96,855
2017
$1,024
$0
$0
--%
$94,863
2016
$984
$0
$0
--%
$91,157
2014
$1,228
$0
$0
--%
$89,805
2013
$2,530
$0
$0
--%
$116,486
2012
$2,306
$0
$0
--%
$105,896

Average Home Price in 33446
Nearby Properties
Zip Code
Price
Bed
Bath
Sqft
Lot
Sold Date
$444,760
2 Beds
2 Baths
1,524 Sqft
2,274 Lot (sqft)
Sold 10/31/2026
$442,269
2 Beds
2 Baths
1,524 Sqft
2,339 Lot (sqft)
Sold 10/20/2026
$540,115
3 Beds
3 Baths
1,407 Sqft
2,531 Lot (sqft)
Sold 10/01/2026
$278,921
3 Beds
2 Baths
1,433 Sqft
43,560 Lot (sqft)
Sold 09/29/2026
$440,712
2 Beds
2 Baths
1,524 Sqft
2,339 Lot (sqft)
Sold 08/22/2026
$587,261
3 Beds
3 Baths
1,407 Sqft
2,487 Lot (sqft)
Sold 07/07/2026
$559,916
3 Beds
3 Baths
1,407 Sqft
2,736 Lot (sqft)
Sold 07/07/2026
$310,355
2 Beds
2 Baths
1,566 Sqft
2,274 Lot (sqft)
Sold 06/05/2026
$337,566
2 Beds
2 Baths
1,649 Sqft
2,339 Lot (sqft)
Sold 05/29/2026