Member Features
Find Real Estate Bargain!
Full foreclosure details
Home value, equity and ownership info
Find homes priced below market
Get full access with a FREE Account
Already a member?
$301,555
Listing Price2beds
1baths
920sqft
5,000sqft lot
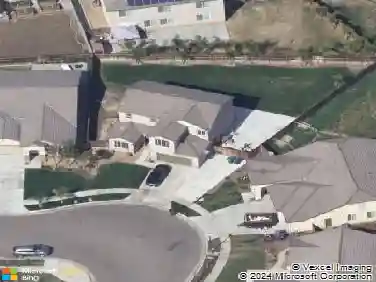
601 I St, Sanger, CA 93657
Member Features
Find Real Estate Bargain!
Full foreclosure details
Home value, equity and ownership info
Find homes priced below market
Get full access with a FREE Account
Already a member?
For Sale
Off Market
Home type
Price / sqft
Year built
Home Details
Interior Details
920
2
1
Has Heating:
No
Heating Type:
N/A
Has Cooling:
No
Cooling Type:
N/A
Has Fuel:
No
Fuel Type:
N/A
Has Basement:
No
Basement Type:
N/A
Has Flooring:
No
Flooring Type:
N/A
Has Fireplace:
Yes
Fireplace Type:
N/A
Property Details
5000
No
No
Type:
N/A
Location:
N/A
Status:
N/A
Number of Spaces:
N/A
N/A
N/A
N/A
N/A
N/A
N/A
N/A
Construction Details
Custom Design
N/A
N/A
N/A
N/A
Tax History
Year
Amount
Land
Improvement
Percent Change
Assessment
2020
$324
$6,307
$17,926
--%
$24,233
2019
$318
$6,184
$17,575
--%
$23,759
2018
$306
$6,063
$17,231
--%
$23,294
2017
$301
$5,945
$16,894
--%
$22,839
2016
$285
$5,829
$16,563
--%
$22,392
2014
$283
$5,630
$15,996
--%
$21,626
2013
$280
$5,605
$15,924
--%
$21,529
2012
$254
$5,496
$15,612
--%
$21,108

Average Home Price in 93657
Nearby Properties
Zip Code
Price
Bed
Bath
Sqft
Lot
Sold Date
$299,680
$299,680
3 Beds
1 Baths
1,006 Sqft
6,100 Lot (sqft)
Sold 07/13/2026
$217,819
$217,819
2 Beds
1 Baths
864 Sqft
7,500 Lot (sqft)
Sold 10/13/2026
$241,393
$241,393
3 Beds
1 Baths
1,008 Sqft
7,500 Lot (sqft)
Sold 10/13/2026
$301,555
$301,555
2 Beds
1 Baths
920 Sqft
5,000 Lot (sqft)
Sold 10/18/2026
$233,004
$233,004
3 Beds
1 Baths
912 Sqft
8,500 Lot (sqft)
Sold 10/13/2026
$281,910
$281,910
3 Beds
1 Baths
912 Sqft
7,450 Lot (sqft)
Sold 10/18/2026
Calculators
Mortgage
Mortgage Calculator
Details for 601 I ST
Property Debt
Foreclosure Contact Details
Similar Homes Nearby

Guides for I St

The real estate market in Fresno and its neighboring cities has shown robust growth from April 2023 to March 2024, with increasing property values, healthy sales volumes, and some location-specific fluctuations.