Member Features
Find Real Estate Bargain!
Full foreclosure details
Home value, equity and ownership info
Find homes priced below market
Get full access with a FREE Account
Already a member?
$455,297
Sold Price1beds
1baths
867sqft
32,248sqft lot
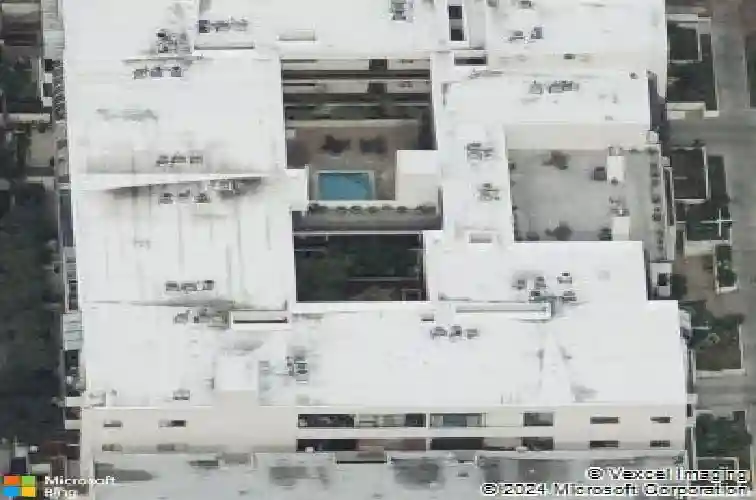
729 S Hobart Blvd, Los Angeles, CA 90005
Member Features
Find Real Estate Bargain!
Full foreclosure details
Home value, equity and ownership info
Find homes priced below market
Get full access with a FREE Account
Already a member?
Recently Sold
Off Market
Home type
Price / sqft
Year built
Home Details
Interior Details
867
1
1
Has Heating:
Yes
Heating Type:
Central
Has Cooling:
Yes
Cooling Type:
Central
Has Fuel:
No
Fuel Type:
N/A
Has Basement:
No
Basement Type:
N/A
Has Flooring:
No
Flooring Type:
N/A
Has Fireplace:
Yes
Fireplace Type:
N/A
Property Details
32248
Yes
Yes
Type:
N/A
Location:
N/A
Status:
N/A
Number of Spaces:
N/A
N/A
N/A
N/A
N/A
N/A
N/A
N/A
Construction Details
Contemporary
Stucco
N/A
N/A
Roll Tar & Gravel
Tax History
Year
Amount
Land
Improvement
Percent Change
Assessment
2019
$1,997
$85,778
$85,778
--%
$171,556
2019
$1,997
$84,097
$84,097
--%
$168,194
2018
$1,983
$82,449
$82,449
--%
$164,898
2017
$1,940
$80,833
$80,833
--%
$161,666
2016
$1,887
$79,249
$79,249
--%
$158,498
2014
$1,872
$76,530
$76,530
--%
$153,060
2013
$1,866
$76,185
$76,185
--%
$152,370
2012
$1,830
$74,692
$74,692
--%
$149,384

Average Home Price in 90005
Nearby Properties
Zip Code
Price
Bed
Bath
Sqft
Lot
Sold Date
$467,440
2 Beds
2 Baths
914 Sqft
73,442 Lot (sqft)
Sold 10/09/2026
$513,351
1 Beds
1 Baths
750 Sqft
64,152 Lot (sqft)
Sold 09/25/2026
$492,651
1 Beds
1 Baths
790 Sqft
51,475 Lot (sqft)
Sold 08/26/2026
$499,573
2 Beds
1 Baths
909 Sqft
32,248 Lot (sqft)
Sold 06/22/2026
$555,000
1 Beds
1 Baths
830 Sqft
64,152 Lot (sqft)
Sold 10/26/2026
$609,000
2 Beds
2 Baths
990 Sqft
13,790 Lot (sqft)
Sold 10/13/2026
$449,000
1 Beds
1 Baths
789 Sqft
32,248 Lot (sqft)
Sold 10/27/2026
$530,000
2 Beds
1 Baths
979 Sqft
51,475 Lot (sqft)
Sold 10/27/2026
$599,000
2 Beds
1 Baths
902 Sqft
51,475 Lot (sqft)
Sold 10/26/2026
Calculators
Mortgage
Mortgage Calculator
Details for 729 S HOBART BLVD
Property Debt
Foreclosure Contact Details
Similar Homes Nearby


Guides for Hobart Blvd

In August 2024, LA’s pre-foreclosures plummeted 50% from July and 60% from last year, suggesting better economic conditions or successful homeowner interventions. Similar trends in San Jose, while SF and SD remain stable. Sacramento shows significant improvement. LA’s efforts stand out. #HousingMarket #LosAngeles