Member Features
Find Real Estate Bargain!
Full foreclosure details
Home value, equity and ownership info
Find homes priced below market
Get full access with a FREE Account
Already a member?
$1,014,093
Sold Price5beds
4baths
2,779sqft
7,503sqft lot
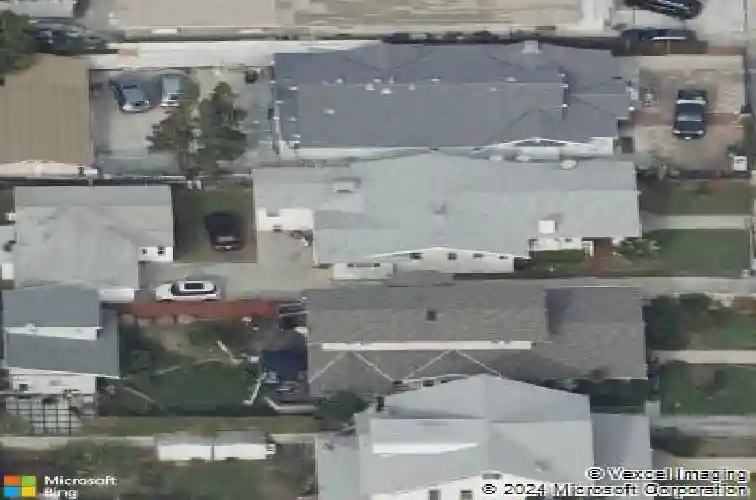
133 N Hobart Blvd, Los Angeles, CA 90004
Member Features
Find Real Estate Bargain!
Full foreclosure details
Home value, equity and ownership info
Find homes priced below market
Get full access with a FREE Account
Already a member?
Recently Sold
Off Market
Home type
Price / sqft
Year built
Home Details
Interior Details
2779
5
4
Has Heating:
Yes
Heating Type:
Central
Has Cooling:
No
Cooling Type:
N/A
Has Fuel:
No
Fuel Type:
N/A
Has Basement:
No
Basement Type:
N/A
Has Flooring:
No
Flooring Type:
N/A
Has Fireplace:
Yes
Fireplace Type:
N/A
Property Details
7503
No
No
Type:
N/A
Location:
N/A
Status:
N/A
Number of Spaces:
N/A
N/A
N/A
N/A
N/A
N/A
N/A
N/A
Construction Details
N/A
N/A
N/A
N/A
N/A
Tax History
Year
Amount
Land
Improvement
Percent Change
Assessment
2019
$5,189
$313,672
$107,924
--%
$421,596
2019
$5,189
$307,522
$105,808
--%
$413,330
2018
$5,004
$301,493
$103,734
--%
$405,227
2017
$4,897
$295,582
$101,700
--%
$397,282
2016
$4,775
$289,787
$99,706
--%
$389,493
2014
$4,729
$279,844
$96,286
--%
$376,130
2013
$4,723
$278,580
$95,851
--%
$374,431
2012
$4,633
$273,118
$93,972
--%
$367,090

Average Home Price in 90004
Nearby Properties
Zip Code
Price
Bed
Bath
Sqft
Lot
Sold Date
$1,677,929
$1,677,929
4 Beds
2 Baths
2,705 Sqft
8,483 Lot (sqft)
Sold 10/09/2026
$1,203,736
$1,203,736
3 Beds
2 Baths
2,436 Sqft
8,002 Lot (sqft)
Sold 08/19/2026
$1,316,167
$1,316,167
5 Beds
2 Baths
2,769 Sqft
8,027 Lot (sqft)
Sold 07/30/2026
$2,430,073
$2,430,073
4 Beds
4 Baths
3,133 Sqft
7,914 Lot (sqft)
Sold 07/22/2026
$1,407,277
$1,407,277
7 Beds
7 Baths
2,951 Sqft
7,293 Lot (sqft)
Sold 07/07/2026
$2,120,853
$2,120,853
3 Beds
4 Baths
3,184 Sqft
5,627 Lot (sqft)
Sold 06/23/2026
$1,387,398
$1,387,398
7 Beds
4 Baths
2,418 Sqft
7,293 Lot (sqft)
Sold 05/26/2026
$1,196,348
$1,196,348
6 Beds
4 Baths
2,718 Sqft
7,659 Lot (sqft)
Sold 10/26/2026
$1,400,000
$1,400,000
4 Beds
2 Baths
2,578 Sqft
7,257 Lot (sqft)
Sold 10/27/2026
Calculators
Mortgage
Mortgage Calculator
Details for 133 N HOBART BLVD
Property Debt
Foreclosure Contact Details
Similar Homes Nearby


Guides for Hobart Blvd

In August 2024, LA’s pre-foreclosures plummeted 50% from July and 60% from last year, suggesting better economic conditions or successful homeowner interventions. Similar trends in San Jose, while SF and SD remain stable. Sacramento shows significant improvement. LA’s efforts stand out. #HousingMarket #LosAngeles