Member Features
Find Real Estate Bargain!
Full foreclosure details
Home value, equity and ownership info
Find homes priced below market
Get full access with a FREE Account
Already a member?
$838,860
Listing Price3beds
2baths
1,474sqft
7,320sqft lot
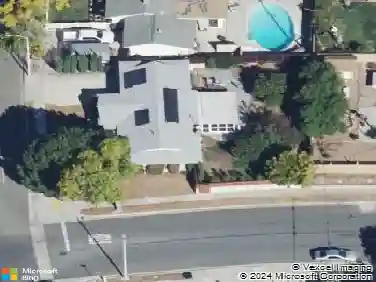
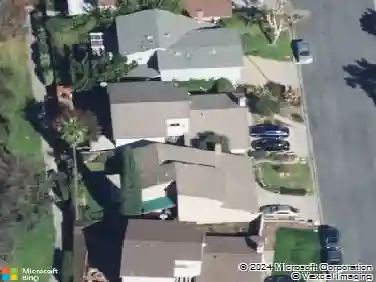
39 Herringbone Ct, Newbury Park, CA 91320
Member Features
Find Real Estate Bargain!
Full foreclosure details
Home value, equity and ownership info
Find homes priced below market
Get full access with a FREE Account
Already a member?
For Sale
Home type
Price / sqft
Year built
Home Details
Single-story cul-de-sac opportunity in Newbury Park with strong upside and endless potential! Tucked away on a quiet cul-de-sac, this home offers a functional layout and a solid foundation for its next chapter. Features include wood flooring throughout the main living areas (linoleum in bathrooms), central air conditioning, and a fireplace that adds warmth to the living space.The home has been modified for wheelchair accessibility and thoughtful adjustments that may suit a variety of living needs. While the property is ready for updating, it presents a rare opportunity to renovate, customize, or invest in a well-located neighborhood. Conveniently located near parks, shopping, and easy freeway access, this is a chance to create value in a location that continues to hold long-term appeal. Priced to attract immediate attention.
Interior Details
1474
3
2
Has Heating:
No
Heating Type:
N/A
Has Cooling:
No
Cooling Type:
N/A
Has Fuel:
No
Fuel Type:
N/A
Has Basement:
No
Basement Type:
N/A
Has Flooring:
No
Flooring Type:
N/A
Has Fireplace:
Yes
Fireplace Type:
N/A
Property Details
7320
No
No
Type:
N/A
Location:
N/A
Status:
N/A
Number of Spaces:
N/A
No
No
No
No
Yes
No
No
Construction Details
N/A
N/A
N/A
N/A
N/A
Tax History
Year
Amount
Land
Improvement
Percent Change
Assessment
2020
$1,433
$20,118
$67,213
--%
$87,331
2019
$1,393
$19,724
$65,896
--%
$85,620
2018
$1,359
$19,338
$64,604
--%
$83,942
2017
$1,325
$18,959
$63,338
--%
$82,297
2016
$1,302
$18,588
$62,097
--%
$80,685
2014
$1,248
$17,951
$59,968
--%
$77,919
2013
$1,231
$17,871
$59,698
--%
$77,569
2012
$1,101
$17,521
$58,528
--%
$76,049

Average Home Price in 91320
Nearby Properties
Zip Code
Price
Bed
Bath
Sqft
Lot
Sold Date
$867,881
$867,881
3 Beds
2 Baths
1,441 Sqft
8,800 Lot (sqft)
Sold 09/11/2026
$934,541
4 Beds
2 Baths
1,630 Sqft
8,100 Lot (sqft)
Sold 08/25/2026
$949,410
$949,410
3 Beds
2 Baths
1,387 Sqft
6,690 Lot (sqft)
Sold 06/01/2026
$865,198
$865,198
3 Beds
2 Baths
1,387 Sqft
6,672 Lot (sqft)
Sold 06/01/2026
$829,000
$829,000
3 Beds
2 Baths
1,525 Sqft
7,159 Lot (sqft)
Sold 10/13/2026
$818,473
$818,473
3 Beds
2 Baths
1,387 Sqft
6,091 Lot (sqft)
Sold 10/27/2026
$998,000
3 Beds
2 Baths
1,474 Sqft
6,290 Lot (sqft)
Sold 10/13/2026
$980,000
4 Beds
2 Baths
1,541 Sqft
8,003 Lot (sqft)
Sold 10/26/2026
$977,000
$977,000
5 Beds
3 Baths
1,444 Sqft
7,994 Lot (sqft)
Sold 10/26/2026