Member Features
Find Real Estate Bargain!
Full foreclosure details
Home value, equity and ownership info
Find homes priced below market
Get full access with a FREE Account
Already a member?
$225,000
Listing Price3beds
2baths
1,440sqft
8,280sqft lot
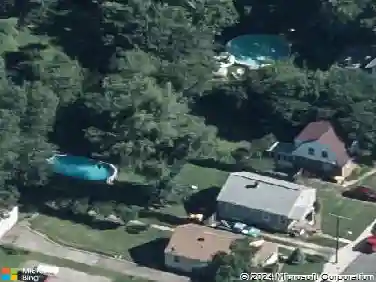
313 N Hammonds Ferry Rd, Linthicum Heights, MD 21090
Member Features
Find Real Estate Bargain!
Full foreclosure details
Home value, equity and ownership info
Find homes priced below market
Get full access with a FREE Account
Already a member?
For Sale
Off Market
Home type
Price / sqft
Year built
Home Details
Great rehab opportunity ! Home is being sold as is. All contents will convey; it will be buyers responsibility to clear out the remaining items. Bathroom on first floor was renovated the beginning of the year; the rest of the home is in need of a full rehab.
Interior Details
1440
3
2
Has Heating:
Yes
Heating Type:
Baseboard
Has Cooling:
Yes
Cooling Type:
Central
Has Fuel:
No
Fuel Type:
N/A
Has Basement:
No
Basement Type:
Basement (unspecified)
Has Flooring:
No
Flooring Type:
N/A
Has Fireplace:
Yes
Fireplace Type:
N/A
Property Details
8280
Yes
Yes
Type:
N/A
Location:
N/A
Status:
N/A
Number of Spaces:
N/A
No
No
No
No
Yes
No
No
Construction Details
Conventional
Siding (not Specified)
N/A
N/A
Composition Shingle
Tax History
Year
Amount
Land
Improvement
Percent Change
Assessment
2021
$2,377
$0
$0
--%
$239,767
2020
$2,337
$128,900
$102,900
--%
$231,800
2019
$2,231
$0
$0
--%
$223,400
2018
$2,199
$0
$0
--%
$215,000
2017
$2,173
$106,400
$100,200
--%
$206,600
2015
$2,141
$106,400
$100,200
--%
$206,600
2014
$2,124
$115,400
$108,700
--%
$224,100
2012
$2,029
$0
$0
--%
$224,100

Average Home Price in 21090
Nearby Properties
Zip Code
Price
Bed
Bath
Sqft
Lot
Sold Date
$439,900
-- Beds
1.5 Baths
1,404 Sqft
9,450 Lot (sqft)
Sold 09/16/2026
$459,527
-- Beds
1 Baths
1,432 Sqft
7,440 Lot (sqft)
Sold 07/13/2026
$452,658
-- Beds
1.5 Baths
1,580 Sqft
6,161 Lot (sqft)
Sold 06/22/2026
$435,000
-- Beds
1 Baths
1,398 Sqft
6,600 Lot (sqft)
Sold 05/22/2026
$570,000
5 Beds
3 Baths
1,528 Sqft
7,440 Lot (sqft)
Sold 10/26/2026
$424,999
3 Beds
2 Baths
1,368 Sqft
8,800 Lot (sqft)
Sold 10/26/2026
$420,000
3 Beds
2 Baths
1,656 Sqft
7,560 Lot (sqft)
Sold 10/26/2026
$339,372
-- Beds
1 Baths
1,368 Sqft
7,000 Lot (sqft)
Sold 10/27/2026
$400,000
3 Beds
2 Baths
1,580 Sqft
6,344 Lot (sqft)
Sold 10/27/2026