Member Features
Find Real Estate Bargain!
Full foreclosure details
Home value, equity and ownership info
Find homes priced below market
Get full access with a FREE Account
Already a member?
$259,900
Listing Price3beds
1baths
2,379sqft
8,580sqft lot
602 S Hammonds Ferry Rd, Linthicum Heights, MD 21090
Member Features
Find Real Estate Bargain!
Full foreclosure details
Home value, equity and ownership info
Find homes priced below market
Get full access with a FREE Account
Already a member?
For Sale
Off Market
Home type
Price / sqft
Year built
Home Details
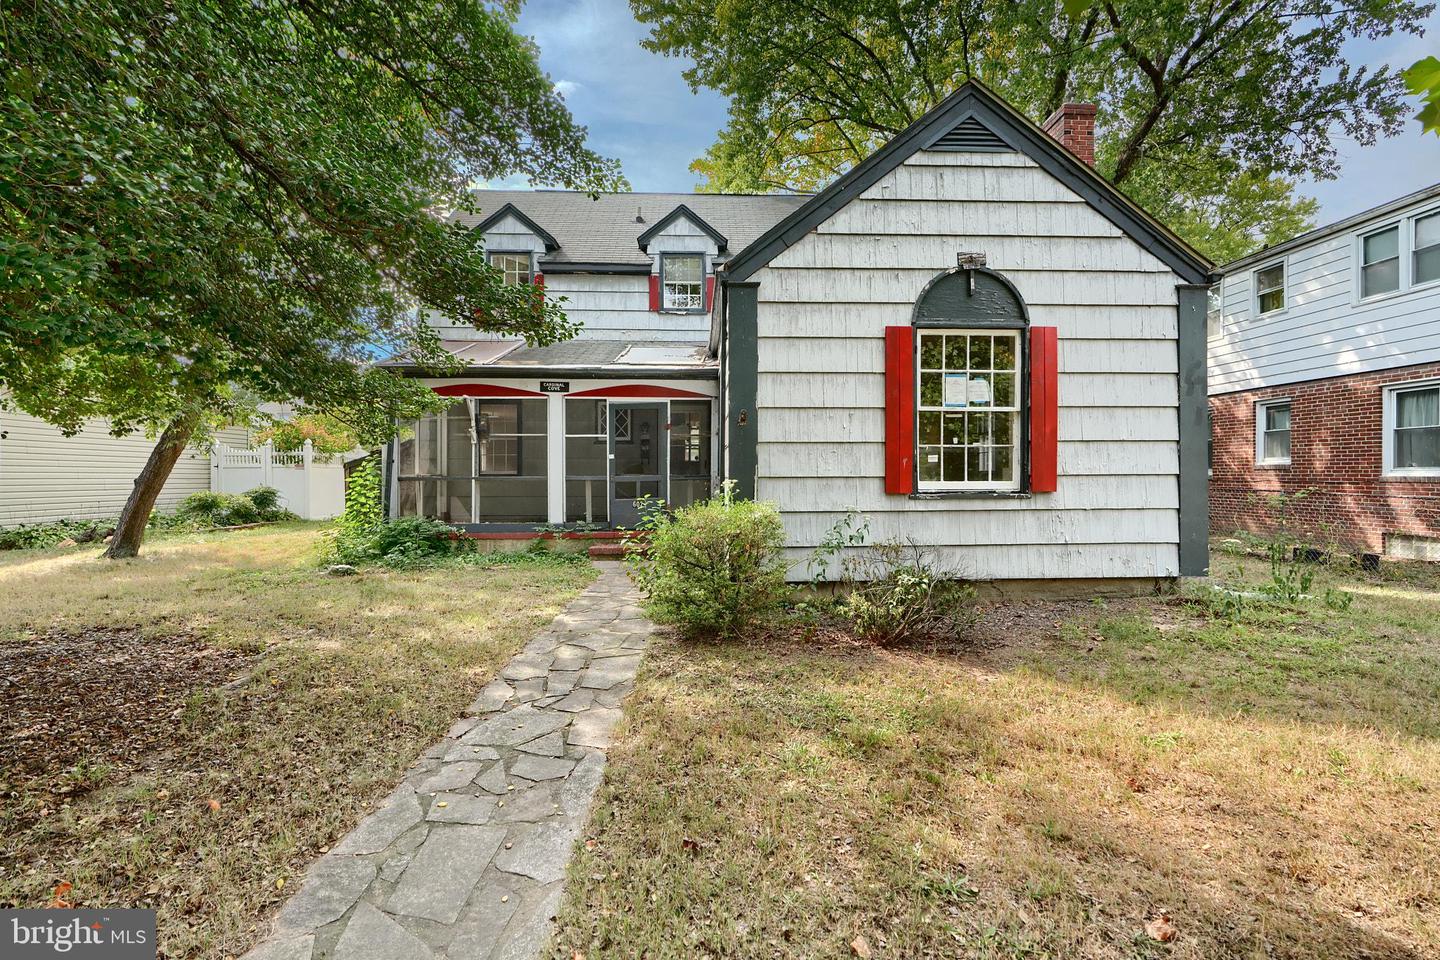
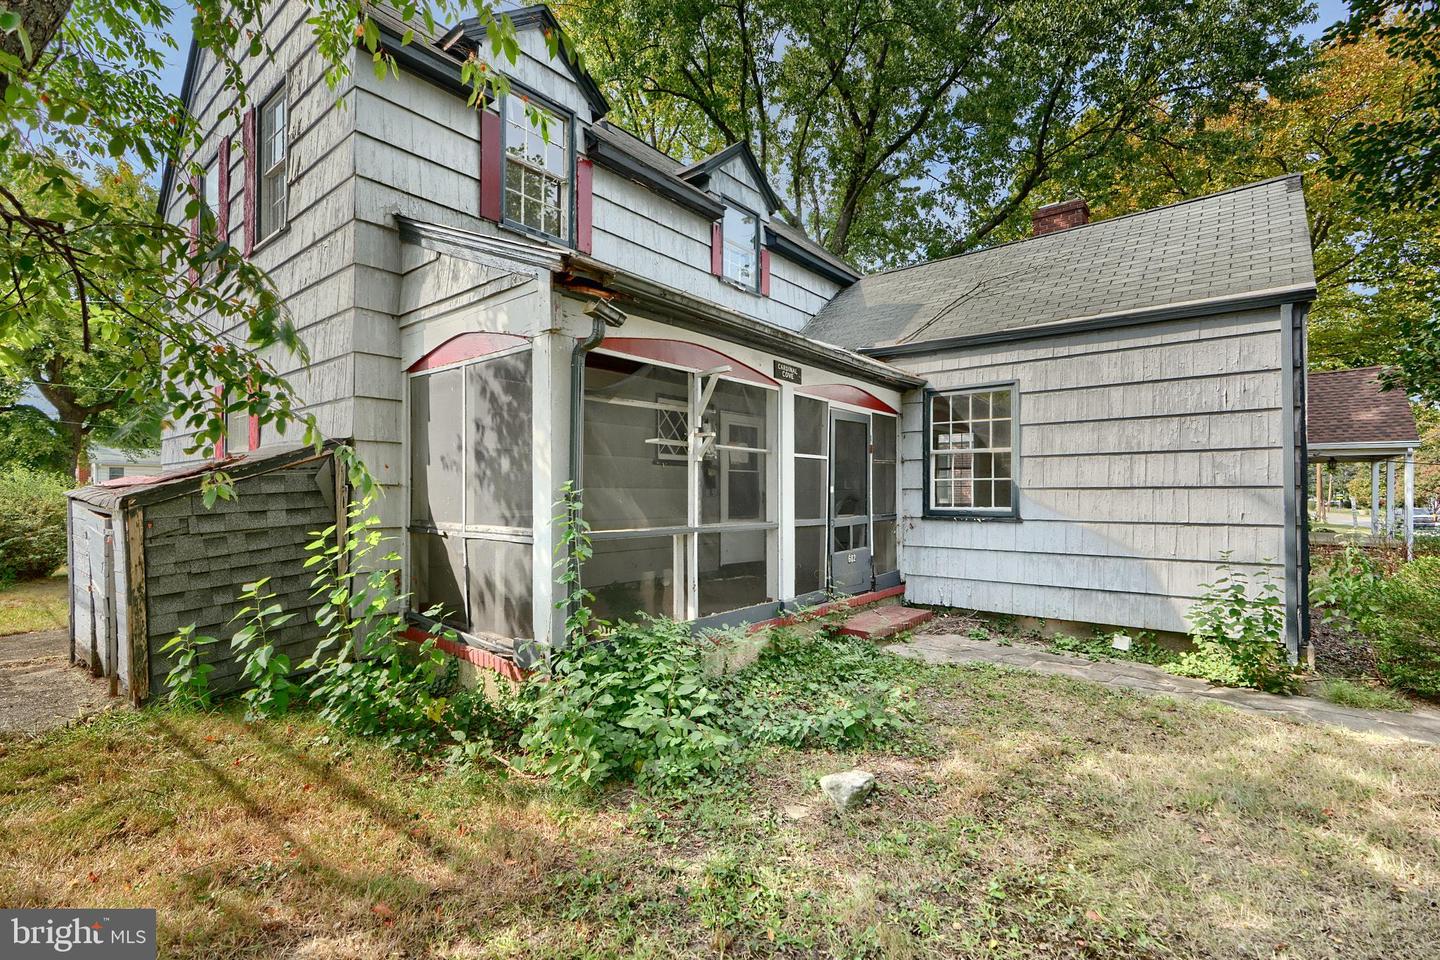
Welcome to this colonial home in the well established neighborhood of Linthicum Heights. Upon entry, you will discover spacious room sizes and hardwood floors from the living room with fireplace to the dining room with wide windows that provides ample natural light, and to the den with wall wood panels. The eat-in kitchen is spacious and has appliances. Venturing to the upper level, you will find a full bath with soaking tub and three bedrooms with built-in closet and hardwood floors. The unfinished lower level awaits your design and personal touch to expand or add more living space. The enclosed porch and large wide yard is a perfect location to entertain and have outdoor fun. Home offers a convenient location. You can walk directly across the street to the best BBQ in town, the 7001 South Dell & Cafe or you can stroll to the Andover Park, which has tennis courts, baseball fields, picnic area and trails. It is also a few minutes away from BWI Airport and Light Rail. So, schedule your showing today!
Interior Details
2379
3
1
Has Heating:
Yes
Heating Type:
Radiant
Has Cooling:
Yes
Cooling Type:
N/A
Has Fuel:
No
Fuel Type:
N/A
Has Basement:
No
Basement Type:
Finished
Has Flooring:
No
Flooring Type:
N/A
Has Fireplace:
Yes
Fireplace Type:
N/A
Property Details
8580
Yes
Yes
Type:
N/A
Location:
N/A
Status:
N/A
Number of Spaces:
N/A
No
No
No
No
Yes
No
No
Construction Details
Conventional
Log/wood Shingle
N/A
N/A
Composition Shingle
Tax History
Year
Amount
Land
Improvement
Percent Change
Assessment
2021
$2,580
$0
$0
--%
$269,667
2020
$2,531
$129,500
$127,200
--%
$256,700
2019
$2,419
$0
$0
--%
$250,500
2018
$2,387
$0
$0
--%
$244,300
2017
$2,361
$107,000
$131,100
--%
$238,100
2015
$2,328
$107,000
$131,100
--%
$238,100
2014
$2,309
$116,000
$138,900
--%
$254,900
2012
$2,210
$0
$0
--%
$254,900

Average Home Price in 21090
Nearby Properties
Zip Code
Price
Bed
Bath
Sqft
Lot
Sold Date
$713,603
-- Beds
2.5 Baths
2,128 Sqft
9,959 Lot (sqft)
Sold 08/12/2026
$650,000
4 Beds
3 Baths
2,364 Sqft
8,000 Lot (sqft)
Sold 10/13/2026
$259,900
3 Beds
1 Baths
2,379 Sqft
8,580 Lot (sqft)
Sold 10/13/2026
$452,346
-- Beds
2 Baths
2,181 Sqft
33,350 Lot (sqft)
Sold 10/13/2026
$500,000
-- Beds
2.5 Baths
2,216 Sqft
18,000 Lot (sqft)
Sold 10/18/2026
$635,037
-- Beds
2.5 Baths
2,689 Sqft
13,918 Lot (sqft)
Sold 10/13/2026
$525,000
3 Beds
3 Baths
2,620 Sqft
7,483 Lot (sqft)
Sold 10/13/2026
$339,000
5 Beds
2 Baths
2,469 Sqft
10,165 Lot (sqft)
Sold 09/29/2026
$580,000
5 Beds
2.5 Baths
2,627 Sqft
8,000 Lot (sqft)
Sold 10/18/2026