Member Features
Find Real Estate Bargain!
Full foreclosure details
Home value, equity and ownership info
Find homes priced below market
Get full access with a FREE Account
Already a member?
$303,415
Listing Price--beds
1baths
986sqft
9,148sqft lot
139 N Grant St, Westmont, IL 60559
Member Features
Find Real Estate Bargain!
Full foreclosure details
Home value, equity and ownership info
Find homes priced below market
Get full access with a FREE Account
Already a member?
For Sale
Off Market
Home type
Price / sqft
Year built
Home Details
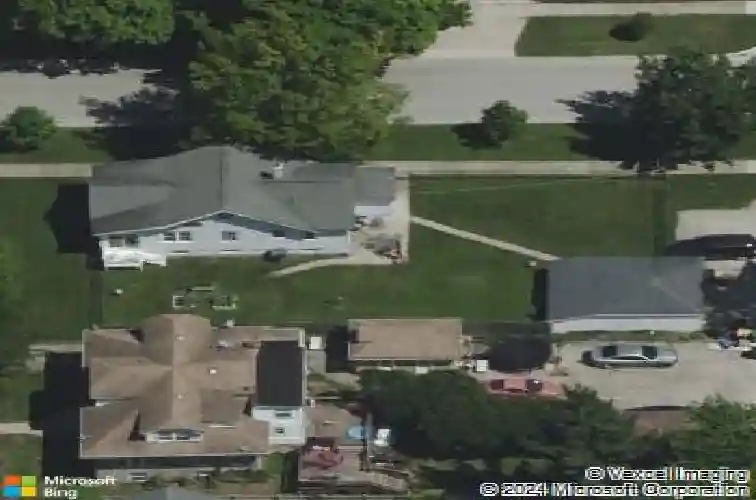
When the homes around you improve, value follows. Welcome to the "Lavender Lady" at 139 N Grant St, ideally located in walk-to-town and train Westmont. Situated on an above-average 60x150 corner lot, this property is surrounded by new construction, luxury renovations, and strong long-term upside. This home offers a functional layout with an updated kitchen and appliances, replacement windows, newer mechanicals and electrical, and a brand-new roof tear-off completed in 2025. The basement is already framed and ready for finishing, including a bath rough-in with shower creating excellent potential for added living space, a rec room, home office, or guest suite. Enjoy a location that buyers love with convenient access to downtown Westmont, Metra commuter rail, restaurants, parks, and shopping. Whether you're looking for a move-in-ready home with future upside or a property in an area defined by continued investment, this one checks all the boxes.
Interior Details
986
N/A
1
Has Heating:
No
Heating Type:
N/A
Has Cooling:
Yes
Cooling Type:
Central
Has Fuel:
No
Fuel Type:
N/A
Has Basement:
No
Basement Type:
Partial
Has Flooring:
No
Flooring Type:
N/A
Has Fireplace:
Yes
Fireplace Type:
N/A
Property Details
9148
No
No
Type:
N/A
Location:
N/A
Status:
N/A
Number of Spaces:
N/A
N/A
N/A
N/A
N/A
N/A
N/A
N/A
Construction Details
N/A
N/A
N/A
N/A
N/A
Tax History
Year
Amount
Land
Improvement
Percent Change
Assessment
2019
$4,092
$30,290
$40,150
--%
$70,440
2018
$3,662
$30,140
$32,320
--%
$62,460
2017
$3,550
$29,000
$31,100
--%
$60,100
2016
$3,475
$27,680
$29,680
--%
$57,360
2015
$3,541
$26,040
$27,920
--%
$53,960
2013
$3,771
$25,160
$33,200
--%
$58,360
2012
$3,677
$26,290
$34,690
--%
$60,980
2011
$3,961
$30,110
$43,460
--%
$73,570

Average Home Price in 60559
Nearby Properties
Zip Code
Price
Bed
Bath
Sqft
Lot
Sold Date
$405,000
-- Beds
1 Baths
1,080 Sqft
3,920 Lot (sqft)
Sold 09/29/2026
$290,705
$290,705
-- Beds
2 Baths
952 Sqft
9,148 Lot (sqft)
Sold 10/13/2026
$337,440
$337,440
-- Beds
1 Baths
952 Sqft
9,148 Lot (sqft)
Sold 10/13/2026
$303,415
$303,415
-- Beds
1 Baths
986 Sqft
9,148 Lot (sqft)
Sold 10/13/2026
$250,353
-- Beds
1 Baths
900 Sqft
3,920 Lot (sqft)
Sold NaN/NaN/NaN
$330,554
$330,554
-- Beds
1 Baths
1,080 Sqft
9,148 Lot (sqft)
Sold 10/18/2026
$369,900
3 Beds
2 Baths
1,008 Sqft
16,988 Lot (sqft)
Sold 07/14/2026
$375,000
3 Beds
1 Baths
1,039 Sqft
9,583 Lot (sqft)
Sold 10/18/2026
$350,000
$350,000
3 Beds
3 Baths
1,113 Sqft
3,920 Lot (sqft)
Sold 09/10/2026