Member Features
Find Real Estate Bargain!
Full foreclosure details
Home value, equity and ownership info
Find homes priced below market
Get full access with a FREE Account
Already a member?
$375,000
Listing Price3beds
3baths
1,630sqft
3,325sqft lot
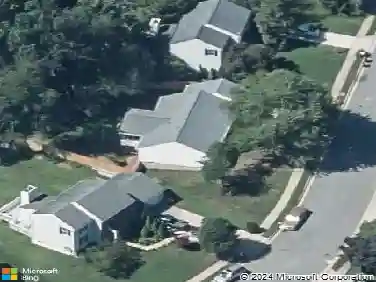
1 Gilland Ct, Nottingham, MD 21236
Member Features
Find Real Estate Bargain!
Full foreclosure details
Home value, equity and ownership info
Find homes priced below market
Get full access with a FREE Account
Already a member?
For Sale
Off Market
Home type
Price / sqft
Year built
Home Details
Perfectly maintained townhome in sought after Ridgelys Choice***End Unit, 3 level finished, 3 Bedroom, 2.5 Bathroom***Sunken Living Room with corner Fireplace open to Dining Room***Slider door from Kitchen to large Deck with steps to Yard***Fresh Paint***The Kitchen was just remodeled featuring upgraded granite countertop, premium wood cabinet, vented-out range hood, dishwashing machine, garbage disposal, LVP flooring and LED Lights***2025 Electric Heat Pump***New LVP flooring at the Upper Level***Siding 2021***Upper Level Bathroom was renovated in 2021***The Roof was replaced in 2010 but in good condition***Refrigerator 2023***Electric Water-Heater 2022***Washer & Dryer 2016***Spacious Family Room and the 2nd full Bathroom at the Lower Level***Slider Walk-Out Basement***Fenced Yard***Low HOA fees***Convenient to shops, restaurants, and close enough to major highways to be perfect for commuting***
Interior Details
1630
3
3
Has Heating:
Yes
Heating Type:
Yes
Has Cooling:
Yes
Cooling Type:
Central
Has Fuel:
No
Fuel Type:
N/A
Has Basement:
No
Basement Type:
Finished
Has Flooring:
No
Flooring Type:
N/A
Has Fireplace:
Yes
Fireplace Type:
N/A
Property Details
3325
Yes
Yes
Type:
N/A
Location:
N/A
Status:
N/A
Number of Spaces:
N/A
N/A
N/A
N/A
N/A
N/A
N/A
N/A
Construction Details
Townhouse
Siding (not Specified)
N/A
N/A
Composition Shingle
Tax History
Year
Amount
Land
Improvement
Percent Change
Assessment
2021
$3,368
$66,000
$148,600
--%
$214,600
2020
$3,474
$0
$0
--%
$212,667
2019
$3,415
$0
$0
--%
$210,733
2018
$3,233
$66,000
$142,800
--%
$208,800
2017
$3,108
$0
$0
--%
$206,767
2015
$2,785
$66,000
$136,700
--%
$202,700
2014
$2,806
$0
$0
--%
$202,700
2012
$2,691
$0
$0
--%
$202,700

Average Home Price in 21236
Nearby Properties
Zip Code
Price
Bed
Bath
Sqft
Lot
Sold Date
$327,396
$327,396
-- Beds
2.5 Baths
1,560 Sqft
1,655 Lot (sqft)
Sold 09/29/2026
$237,207
$237,207
-- Beds
1.5 Baths
1,446 Sqft
2,383 Lot (sqft)
Sold 09/23/2026
$246,371
$246,371
-- Beds
1 Baths
1,596 Sqft
950 Lot (sqft)
Sold 08/20/2026
$232,290
$232,290
-- Beds
2 Baths
1,436 Sqft
1,433 Lot (sqft)
Sold 08/07/2026
$354,999
-- Beds
3 Baths
1,630 Sqft
2,000 Lot (sqft)
Sold 10/26/2026
$349,900
$349,900
3 Beds
3 Baths
1,630 Sqft
2,000 Lot (sqft)
Sold 10/13/2026
$315,000
$315,000
3 Beds
2 Baths
1,390 Sqft
2,500 Lot (sqft)
Sold 10/26/2026
$305,704
$305,704
-- Beds
2 Baths
1,390 Sqft
2,500 Lot (sqft)
Sold 10/26/2026
$329,000
-- Beds
2 Baths
1,430 Sqft
3,325 Lot (sqft)
Sold 10/27/2026