Member Features
Find Real Estate Bargain!
Full foreclosure details
Home value, equity and ownership info
Find homes priced below market
Get full access with a FREE Account
Already a member?
$974,999
Listing Price4beds
3baths
1,424sqft
6,434sqft lot
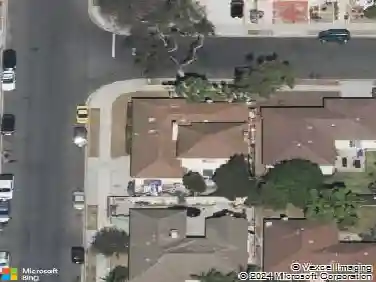
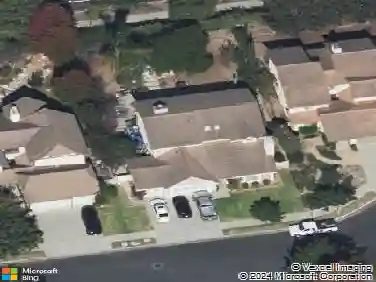
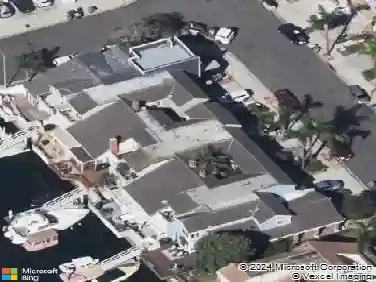
1350 Elder St, Oxnard, CA 93036
Member Features
Find Real Estate Bargain!
Full foreclosure details
Home value, equity and ownership info
Find homes priced below market
Get full access with a FREE Account
Already a member?
For Sale
Off Market
Home type
Price / sqft
Year built
Home Details
INCOME‑PRODUCING DUPLEX IN NORTH OXNARD - INVESTOR READY! Fully renovated and ready for immediate occupancy. No immediate repairs/improvements needed. Main house (3+2, 1,425 sq ft) rents for approximately $4,000/month; permitted ADU (1 +1, 397 sq ft) estimated at $2,200/month. Ideal for investors looking for turnkey income. Pro Forma (Estimates): Estimate Gross Scheduled Income: $74,400/year - Estimated Operating Expenses: $22,473 -Estimated Net Operating Income: $51,927 Highlights:Solar (2 yrs -owned), updated HVAC (2 yrs), newer kitchen (4 yrs), newer roof (4 yrs)& more, prime location near beaches & freeway access. Buyer to independently verify all info. Figures shown are estimates only. Buyer to verify all income, expenses, permits, and property details independently. THIS ESTIMATE IS BASED ON PREVIOUS MARKET FACTORS AND ARE NOT GUARANTEED.Whether youre expanding your portfolio or looking to offset your mortgage with rental income, this turnkey duplex delivers a unique blend of modern amenities, location, and investment potential. Dont miss your chance to secure a high-performing asset in one of Oxnards most sought-after areas.
Interior Details
1424
4
3
Has Heating:
No
Heating Type:
N/A
Has Cooling:
No
Cooling Type:
N/A
Has Fuel:
No
Fuel Type:
N/A
Has Basement:
No
Basement Type:
N/A
Has Flooring:
No
Flooring Type:
N/A
Has Fireplace:
Yes
Fireplace Type:
N/A
Property Details
6434
No
No
Type:
N/A
Location:
N/A
Status:
N/A
Number of Spaces:
N/A
No
No
No
No
Yes
No
No
Construction Details
N/A
N/A
N/A
N/A
N/A
Tax History
Year
Amount
Land
Improvement
Percent Change
Assessment
2020
$6,458
$335,000
$180,000
--%
$515,000
2019
$4,063
$162,701
$162,701
--%
$325,402
2018
$4,007
$159,511
$159,511
--%
$319,022
2017
$3,803
$156,384
$156,384
--%
$312,768
2016
$3,671
$153,318
$153,318
--%
$306,636
2014
$3,669
$148,058
$148,058
--%
$296,116
2013
$3,681
$147,390
$147,390
--%
$294,780
2012
$4,052
$144,500
$144,500
--%
$289,000

Average Home Price in 93036
Nearby Properties
Zip Code
Price
Bed
Bath
Sqft
Lot
Sold Date
$826,577
$826,577
3 Beds
3 Baths
1,424 Sqft
6,634 Lot (sqft)
Sold 10/17/2026
$765,038
$765,038
3 Beds
2 Baths
1,399 Sqft
6,534 Lot (sqft)
Sold 09/25/2026
$780,400
$780,400
3 Beds
2.5 Baths
1,618 Sqft
6,684 Lot (sqft)
Sold 09/25/2026
$792,074
$792,074
3 Beds
2 Baths
1,424 Sqft
6,434 Lot (sqft)
Sold 09/10/2026
$722,855
$722,855
3 Beds
2 Baths
1,479 Sqft
6,000 Lot (sqft)
Sold 08/22/2026
$672,587
$672,587
4 Beds
2 Baths
1,278 Sqft
6,046 Lot (sqft)
Sold 07/09/2026
$707,547
$707,547
4 Beds
2 Baths
1,510 Sqft
6,350 Lot (sqft)
Sold 07/08/2026
$822,160
$822,160
3 Beds
2 Baths
1,561 Sqft
6,434 Lot (sqft)
Sold 05/22/2026
$805,019
$805,019
4 Beds
2 Baths
1,482 Sqft
6,222 Lot (sqft)
Sold 05/18/2026