Member Features
Find Real Estate Bargain!
Full foreclosure details
Home value, equity and ownership info
Find homes priced below market
Get full access with a FREE Account
Already a member?
$649,000
Listing Price4beds
3baths
1,287sqft
19,602sqft lot
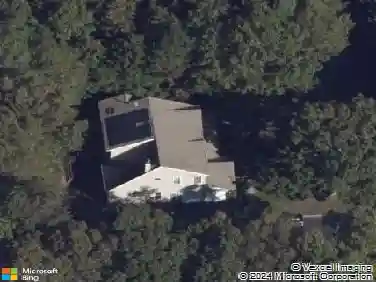
188 Donegan Ave, East Patchogue, NY 11772
Member Features
Find Real Estate Bargain!
Full foreclosure details
Home value, equity and ownership info
Find homes priced below market
Get full access with a FREE Account
Already a member?
For Sale
Home type
Price / sqft
Year built
Home Details
Welcome to 188 Donegan Ave. where old meets new. This Charming Cape Features many modern updates including New Hardwood Floors ,New Kitchen with Quartz countertop , White Shaker cabinets and soft closing drawers ,New Fridge, New Microwave ,New Full Bath on main floor features a heated floor .There are new A/C units on both floors. Upstairs you will find two bedrooms with refinished hardwood floors and a full bath with a New Vinyl Planking floor. The Partially finished basement contains a full Bath with Laundry area and your 4th Bedroom. This area has endless possibilities to add an office, playroom or just utilize for extra storage .Location is prime with being situated near historic Bellport Village ,Nearby attractions Include The Bellport Country Club ,Gateway Playhouse, and Bellport Marina .Plenty of Boutique Style Shopping, Restaurants, along with all of what The Village has to offer . Downtown Patchogue features waterfront restaurants with entertainment and plenty of night life or catch a ride on the ferry to Davis Park Fire island. This house has it all and more .
Interior Details
1287
4
3
Has Heating:
Yes
Heating Type:
Radiant
Has Cooling:
No
Cooling Type:
N/A
Has Fuel:
No
Fuel Type:
N/A
Has Basement:
No
Basement Type:
Basement (unspecified)
Has Flooring:
No
Flooring Type:
N/A
Has Fireplace:
Yes
Fireplace Type:
N/A
Property Details
19602
No
No
Type:
N/A
Location:
N/A
Status:
N/A
Number of Spaces:
N/A
N/A
N/A
N/A
N/A
N/A
N/A
N/A
Construction Details
Cape Cod
Brick
N/A
N/A
N/A
Tax History
Year
Amount
Land
Improvement
Percent Change
Assessment
2020
$5,271
$350
$1,310
--%
$1,660
2018
$5,026
$350
$1,310
--%
$1,660
2017
$4,870
$350
$1,310
--%
$1,660
2016
$4,866
$350
$1,310
--%
$1,660
2015
$4,821
$350
$1,310
--%
$1,660
2014
$5,611
$350
$1,310
--%
$1,660
2013
$5,550
$350
$1,310
--%
$1,660

Average Home Price in 11772
Nearby Properties
Zip Code
Price
Bed
Bath
Sqft
Lot
Sold Date
$472,095
$472,095
3 Beds
1 Baths
1,358 Sqft
14,810 Lot (sqft)
Sold 10/14/2026
$842,669
$842,669
3 Beds
1 Baths
1,340 Sqft
10,890 Lot (sqft)
Sold 09/10/2026
$561,047
2 Beds
1 Baths
1,473 Sqft
14,810 Lot (sqft)
Sold 08/12/2026
$629,174
3 Beds
1 Baths
1,234 Sqft
13,068 Lot (sqft)
Sold NaN/NaN/NaN
$775,000
$775,000
3 Beds
2 Baths
1,312 Sqft
10,454 Lot (sqft)
Sold 10/13/2026
$499,000
3 Beds
1 Baths
1,149 Sqft
14,810 Lot (sqft)
Sold 10/26/2026
$715,000
$715,000
3 Beds
1 Baths
1,312 Sqft
10,454 Lot (sqft)
Sold 10/27/2026
$718,630
3 Beds
1 Baths
1,160 Sqft
14,375 Lot (sqft)
Sold 10/27/2026
$799,000
3 Beds
2 Baths
1,224 Sqft
14,375 Lot (sqft)
Sold 10/13/2026