Member Features
Find Real Estate Bargain!
Full foreclosure details
Home value, equity and ownership info
Find homes priced below market
Get full access with a FREE Account
Already a member?
$5,968,349
Sold Price5beds
4.5baths
3,889sqft
9,367sqft lot
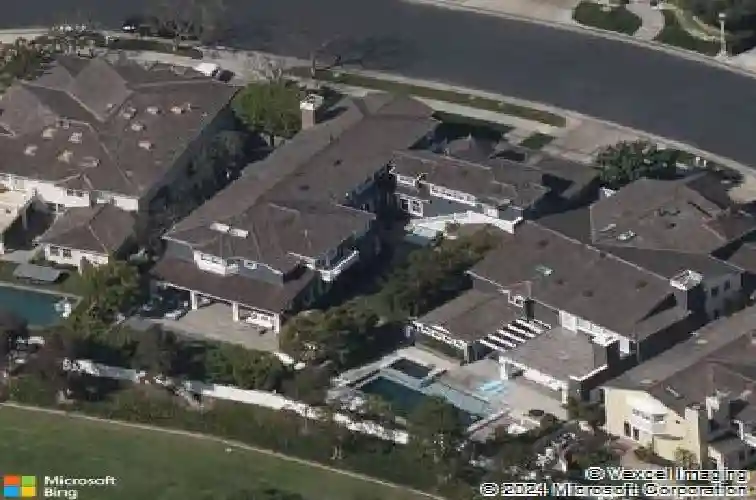
7 Cape Danbury, Newport Beach, CA 92660
Member Features
Find Real Estate Bargain!
Full foreclosure details
Home value, equity and ownership info
Find homes priced below market
Get full access with a FREE Account
Already a member?
Recently Sold
Off Market
Home type
Price / sqft
Year built
Home Details
Interior Details
3889
5
4.5
Has Heating:
No
Heating Type:
N/A
Has Cooling:
No
Cooling Type:
N/A
Has Fuel:
No
Fuel Type:
N/A
Has Basement:
No
Basement Type:
N/A
Has Flooring:
No
Flooring Type:
N/A
Has Fireplace:
Yes
Fireplace Type:
N/A
Property Details
9367
No
No
Type:
N/A
Location:
N/A
Status:
N/A
Number of Spaces:
N/A
N/A
N/A
N/A
N/A
N/A
N/A
N/A
Construction Details
N/A
N/A
N/A
N/A
N/A
Tax History
Year
Amount
Land
Improvement
Percent Change
Assessment
2020
$36,814
$2,647,318
$801,608
--%
$3,448,926
2019
$36,194
$2,595,409
$785,891
--%
$3,381,300
2018
$35,478
$2,544,518
$770,482
--%
$3,315,000
2017
$17,571
$941,673
$673,427
--%
$1,615,100
2016
$17,188
$923,209
$660,223
--%
$1,583,432
2014
$19,851
$891,529
$637,568
--%
$1,529,097
2013
$19,777
$887,500
$634,687
--%
$1,522,187
2012
$19,131
$870,098
$622,243
--%
$1,492,341

Average Home Price in 92660
Nearby Properties
Zip Code
Price
Bed
Bath
Sqft
Lot
Sold Date
$5,968,349
$5,968,349
5 Beds
4.5 Baths
3,889 Sqft
9,367 Lot (sqft)
Sold 10/17/2026
$4,822,067
$4,822,067
4 Beds
3.5 Baths
3,507 Sqft
6,045 Lot (sqft)
Sold 09/16/2026
$5,748,121
$5,748,121
3 Beds
4 Baths
3,519 Sqft
12,834 Lot (sqft)
Sold 08/11/2026
$8,607,152
$8,607,152
5 Beds
5.5 Baths
4,130 Sqft
6,240 Lot (sqft)
Sold 06/16/2026
$5,583,049
$5,583,049
4 Beds
4.5 Baths
3,880 Sqft
6,805 Lot (sqft)
Sold 06/02/2026
$6,500,000
$6,500,000
3 Beds
3 Baths
3,784 Sqft
5,622 Lot (sqft)
Sold 10/12/2026
$5,870,028
$5,870,028
3 Beds
2.5 Baths
3,866 Sqft
12,834 Lot (sqft)
Sold 10/18/2026
$5,995,000
$5,995,000
4 Beds
5 Baths
4,378 Sqft
11,250 Lot (sqft)
Sold 10/13/2026
$7,195,000
$7,195,000
4 Beds
4 Baths
4,010 Sqft
6,914 Lot (sqft)
Sold 09/29/2026
Calculators
Mortgage
Mortgage Calculator
Details for 7 CAPE DANBURY
Property Debt
Foreclosure Contact Details
Similar Homes Nearby


Guides for Cape Danbury

Santa Ana’s real estate market shows substantial growth, with home values reaching $970K in June 2024, up from $799.5K in July 2023. Neighboring cities also display varied market trends. The data indicates a promising market for potential buyers and investors.