Member Features
Find Real Estate Bargain!
Full foreclosure details
Home value, equity and ownership info
Find homes priced below market
Get full access with a FREE Account
Already a member?
$680,000
Listing Price4beds
4baths
2,286sqft
92,479sqft lot
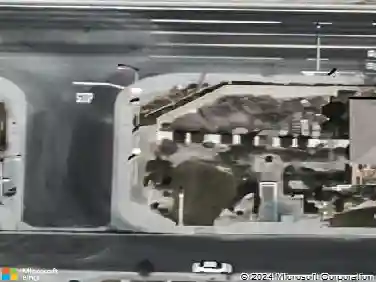
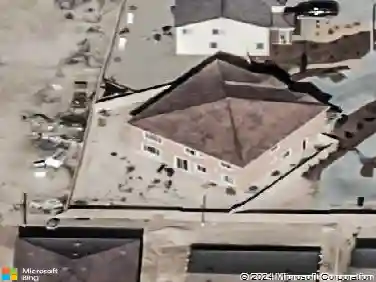
8009 W Avenue D12, Lancaster, CA 93536
Member Features
Find Real Estate Bargain!
Full foreclosure details
Home value, equity and ownership info
Find homes priced below market
Get full access with a FREE Account
Already a member?
For Sale
Off Market
Home type
Price / sqft
Year built
Home Details
Interior Details
2286
4
4
Has Heating:
Yes
Heating Type:
Central
Has Cooling:
Yes
Cooling Type:
Central
Has Fuel:
No
Fuel Type:
N/A
Has Basement:
No
Basement Type:
N/A
Has Flooring:
No
Flooring Type:
N/A
Has Fireplace:
Yes
Fireplace Type:
N/A
Property Details
92479
No
No
Type:
N/A
Location:
N/A
Status:
N/A
Number of Spaces:
N/A
N/A
N/A
N/A
N/A
N/A
N/A
N/A
Construction Details
N/A
N/A
N/A
N/A
N/A
Tax History
Year
Amount
Land
Improvement
Percent Change
Assessment
2019
$3,081
$61,362
$184,432
--%
$245,794
2019
$3,081
$60,159
$180,816
--%
$240,975
2018
$3,058
$58,980
$177,271
--%
$236,251
2017
$3,001
$57,824
$173,796
--%
$231,620
2016
$2,861
$56,691
$170,389
--%
$227,080
2014
$2,817
$54,747
$164,543
--%
$219,290
2013
$3,070
$25,900
$212,100
--%
$238,000
2012
$3,068
$26,000
$213,300
--%
$239,300

Average Home Price in 93536
Nearby Properties
Zip Code
Price
Bed
Bath
Sqft
Lot
Sold Date
$797,047
$797,047
3 Beds
2 Baths
2,548 Sqft
109,028 Lot (sqft)
Sold 10/27/2026
$680,000
$680,000
4 Beds
4 Baths
2,286 Sqft
92,479 Lot (sqft)
Sold 10/26/2026
$653,293
$653,293
4 Beds
3 Baths
2,324 Sqft
109,089 Lot (sqft)
Sold 10/27/2026
$295,000
$295,000
3 Beds
2 Baths
1,989 Sqft
109,018 Lot (sqft)
Sold 10/27/2026
$637,485
$637,485
4 Beds
3 Baths
2,467 Sqft
109,130 Lot (sqft)
Sold 10/27/2026
Calculators
Mortgage
Mortgage Calculator
Details for 8009 W AVENUE D12
Property Debt
Foreclosure Contact Details
Similar Homes Nearby

Guides for Avenue D12

In August 2024, LA’s pre-foreclosures plummeted 50% from July and 60% from last year, suggesting better economic conditions or successful homeowner interventions. Similar trends in San Jose, while SF and SD remain stable. Sacramento shows significant improvement. LA’s efforts stand out. #HousingMarket #LosAngeles