Member Features
Find Real Estate Bargain!
Full foreclosure details
Home value, equity and ownership info
Find homes priced below market
Get full access with a FREE Account
Already a member?
$575,000
Listing Price4beds
2baths
1,540sqft
6,664sqft lot
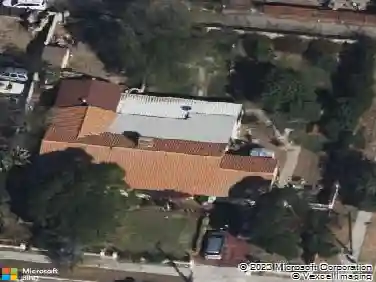
659 S 7th St, Colton, CA 92324
Member Features
Find Real Estate Bargain!
Full foreclosure details
Home value, equity and ownership info
Find homes priced below market
Get full access with a FREE Account
Already a member?
For Sale
Off Market
Home type
Price / sqft
Year built
Home Details
Excellent investment opportunity in the city of Colton. This legal two-unit property features two separate 2 bedroom, 1 bathroom units, each with its own gas, water, and electric meter.nnLive in one unit and rent out the other, or rent out both for steady cash flow. One unit will be delivered vacant, projected rent is $1,850 per month, and the second unit is rented at $855 per month. The property generates a gross scheduled income of $32,400 per year, with low annual operating expenses of just $4,200. Net operating income is approximately $28,200 annually.nnBoth homes have new roofs, and while the interiors could use some cosmetic upgrades and general TLC, the property offers strong value-add potential. Situated on a 6,664 square foot lot, the property includes driveway parking and a storage shed. No rent control. Eligible for FHA, Conventional, and VA financing.nnDo not disturb occupants. Drive by only. Ideal for investors or owner-occupants looking for a multi-unit property with income, equity potential, and long-term upside.
Interior Details
1540
4
2
Has Heating:
Yes
Heating Type:
Floor/wall Furnace
Has Cooling:
Yes
Cooling Type:
Refrigerator
Has Fuel:
No
Fuel Type:
N/A
Has Basement:
No
Basement Type:
N/A
Has Flooring:
No
Flooring Type:
N/A
Has Fireplace:
Yes
Fireplace Type:
N/A
Property Details
6664
Yes
Yes
Type:
N/A
Location:
N/A
Status:
N/A
Number of Spaces:
N/A
No
Yes
No
No
No
No
No
Construction Details
Conventional
N/A
N/A
N/A
Composition Shingle
Tax History
Year
Amount
Land
Improvement
Percent Change
Assessment
2020
$2,379
$54,121
$124,480
--%
$178,601
2019
$2,315
$53,060
$122,039
--%
$175,099
2018
$2,278
$52,020
$119,646
--%
$171,666
2017
$2,199
$51,000
$117,300
--%
$168,300
2016
$2,205
$50,763
$110,662
--%
$10,538
2014
$170
$4,759
$5,418
--%
$10,177
2013
$172
$4,737
$5,394
--%
$10,131
2012
$184
$4,644
$5,288
--%
$9,932

Average Home Price in 92324
Nearby Properties
Zip Code
Price
Bed
Bath
Sqft
Lot
Sold Date
$575,000
$575,000
4 Beds
2 Baths
1,540 Sqft
6,664 Lot (sqft)
Sold 09/29/2026
Calculators
Mortgage
Mortgage Calculator
Details for 659 S 7TH ST
Property Debt
Foreclosure Contact Details
Similar Homes Nearby

Guides for 7 Th St

San Bernardino’s real estate values rose steadily in early to mid-2024, with average property values peaking at $500K in May. Sale prices per sq. ft also increased modestly despite a subtle decrease in number of properties sold. Comparison with nearby cities shows varied market trends.