Member Features
Find Real Estate Bargain!
Full foreclosure details
Home value, equity and ownership info
Find homes priced below market
Get full access with a FREE Account
Already a member?
$499,000
Listing Price3beds
2.5baths
1,726sqft
10,019sqft lot
1709 NE 41st St, Cape Coral, FL 33909
Member Features
Find Real Estate Bargain!
Full foreclosure details
Home value, equity and ownership info
Find homes priced below market
Get full access with a FREE Account
Already a member?
For Sale
Off Market
Home type
Price / sqft
Year built
Home Details
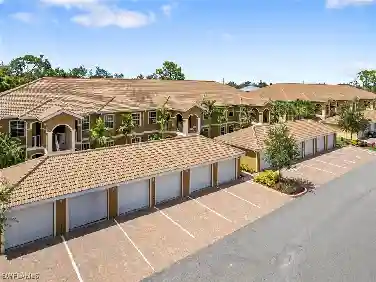
TURNKEY INVESTMENT PROPERTY CAPE CORAL | $520K | $2,400/MO FIXED LEASEnCASH FLOWING RENTAL BUSINESS READY DAY 1! Generates $30K+ annually from closing. Perfect for Airbnb investors, long-term rentals or Florida portfolio diversification.n FINANCIAL HIGHLIGHTS:n Current rent: $2,400/month (1-year fixed lease)n Proven Airbnb history (documented bookings & revenue)n Estimated ROI: 5.8% + Cape Coral appreciation (12% ROY 2026)n PRIME CAPE CORAL LOCATION - Investor Goldminen 1709 NE 41st St | Family neighborhood | Schools, hospitals, shopping nearbyn Explosive growth zone post-2024 recovery (billion$ reconstruction)n Canal access | Short-term rental magnet (fishing/golf/boating tourists)n TURNKEY FEATURES:n 3 bedrooms + Den / 2 bath | 2,000sf | Private Jacuzzi | 2025 New Constructionn Airbnb ready: Fully furnished n Rent-ready: Tenant paying | Insurance/taxes current | Low maintenancen RARE OPPORTUNITY:n Instant positive cashflow (no vacancy risk)n Cape Coral market: +12% appreciation projected 2026nCanal-Front Income Property Dual Rental Potential | No HOA | Seller MotivatednSerious investors this is the opportunity you wait for.
Interior Details
1726
3
2.5
Has Heating:
No
Heating Type:
N/A
Has Cooling:
No
Cooling Type:
N/A
Has Fuel:
No
Fuel Type:
N/A
Has Basement:
No
Basement Type:
N/A
Has Flooring:
No
Flooring Type:
N/A
Has Fireplace:
Yes
Fireplace Type:
N/A
Property Details
10019
No
No
Type:
N/A
Location:
N/A
Status:
N/A
Number of Spaces:
N/A
N/A
N/A
N/A
N/A
N/A
N/A
N/A
Construction Details
N/A
N/A
N/A
N/A
N/A
Tax History
Year
Amount
Land
Improvement
Percent Change
Assessment
2020
$493
$9,200
$0
--%
$9,200
2019
$523
$12,000
$0
--%
$12,000
2018
$551
$13,500
$0
--%
$13,500
2017
$506
$12,274
$0
--%
$12,274
2016
$502
$13,000
$0
--%
$13,000
2014
$369
$0
$0
--%
$11,600
2013
$268
$0
$0
--%
$7,600
2012
$327
$0
$0
--%
$11,100

Average Home Price in 33909
Nearby Properties
Zip Code
Price
Bed
Bath
Sqft
Lot
Sold Date
$326,888
$326,888
3 Beds
2 Baths
1,477 Sqft
10,498 Lot (sqft)
Sold 10/26/2026
$432,800
$432,800
4 Beds
3 Baths
1,782 Sqft
10,019 Lot (sqft)
Sold NaN/NaN/NaN
$339,900
$339,900
4 Beds
2 Baths
1,937 Sqft
10,019 Lot (sqft)
Sold 10/26/2026
$355,298
$355,298
3 Beds
2 Baths
1,551 Sqft
10,193 Lot (sqft)
Sold 11/02/2026
$359,150
$359,150
4 Beds
2 Baths
1,755 Sqft
10,149 Lot (sqft)
Sold 11/02/2026
$340,000
$340,000
3 Beds
2 Baths
1,800 Sqft
10,019 Lot (sqft)
Sold 11/02/2026
$270,000
$270,000
3 Beds
2 Baths
1,579 Sqft
10,498 Lot (sqft)
Sold 10/27/2026
$363,150
$363,150
3 Beds
2 Baths
1,672 Sqft
10,280 Lot (sqft)
Sold 10/26/2026
$389,900
$389,900
3 Beds
2 Baths
1,580 Sqft
10,019 Lot (sqft)
Sold 10/26/2026