Member Features
Find Real Estate Bargain!
Full foreclosure details
Home value, equity and ownership info
Find homes priced below market
Get full access with a FREE Account
Already a member?
$287,000
Listing Price3beds
2baths
1,742sqft
7,198sqft lot
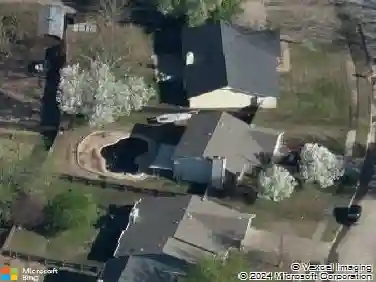
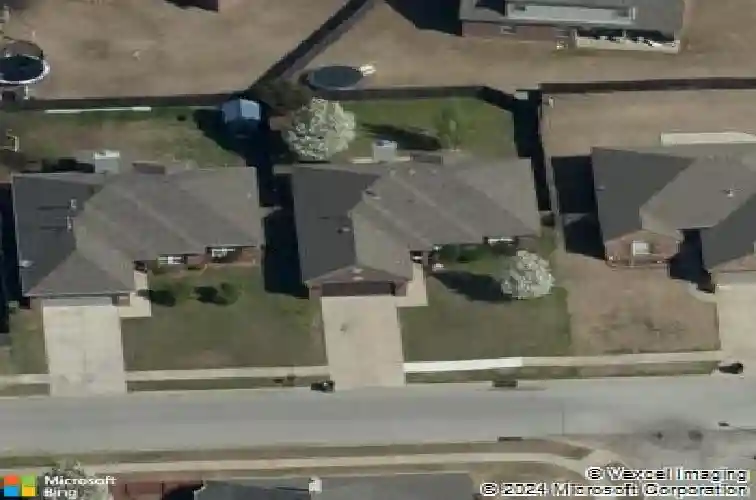
20495 E 33rd Pl S, Broken Arrow, OK 74014
Member Features
Find Real Estate Bargain!
Full foreclosure details
Home value, equity and ownership info
Find homes priced below market
Get full access with a FREE Account
Already a member?
For Sale
Off Market
Home type
Price / sqft
Year built
Home Details
Take a look at this beautiful, move-in ready, full brick home with a GREAT FLOOR PLANperfect for you and yournfamily! Located in the friendly community of Renaissance Park, this home is just across the street from the HUGEnneighborhood park featuring a pool, clubhouse, walking trails, and playground. No need to travel far for outdoor funyour familys favorite activities are right in the neighborhood! Inside, the home boasts a spacious open living area with soaring ceilings and a fireplace. The bar-height counter seating overlooking the kitchen is ideal for casual meals or entertaining. The kitchen features upgraded granite counters and black appliances (refrigerator included!), a pantry, cozy breakfast nook, and direct access to the patio and large, fenced-in backyardperfect for kids and pets to play. The generously sized master suite fits king-size furniture and includes a walk-in closet, dual sinks with upgraded granite, and a luxurious soaking tub in the private en-suite bath. This home checks all the boxes for family-friendly livingschedule your visit today.
Interior Details
1742
3
2
Has Heating:
Yes
Heating Type:
Central
Has Cooling:
Yes
Cooling Type:
Central
Has Fuel:
No
Fuel Type:
N/A
Has Basement:
No
Basement Type:
N/A
Has Flooring:
No
Flooring Type:
N/A
Has Fireplace:
Yes
Fireplace Type:
N/A
Property Details
7198
No
No
Type:
Garage, Attached
Location:
N/A
Status:
N/A
Number of Spaces:
2
No
No
No
No
No
No
No
Construction Details
N/A
Aluminum Siding
N/A
N/A
Composition Shingle
Tax History
Year
Amount
Land
Improvement
Percent Change
Assessment
2020
$2,313
$3,024
$18,215
--%
$21,239
2019
$2,227
$3,021
$17,207
--%
$20,228
2018
$2,086
$2,994
$16,270
--%
$19,264
2017
$1,985
$2,969
$15,378
--%
$18,347
2016
$1,886
$2,924
$14,550
--%
$17,474
2014
$1,712
$2,800
$13,049
--%
$15,849
2013
$1,703
$2,800
$13,049
--%
$15,849
2012
$1,705
$2,800
$13,049
--%
$15,849

Average Home Price in 74014
Nearby Properties
Zip Code
Price
Bed
Bath
Sqft
Lot
Sold Date
$244,489
-- Beds
2 Baths
1,645 Sqft
9,599 Lot (sqft)
Sold 07/16/2026
$272,142
$272,142
3 Beds
2 Baths
1,561 Sqft
10,724 Lot (sqft)
Sold 07/07/2026
$247,637
-- Beds
-- Baths
1,544 Sqft
8,574 Lot (sqft)
Sold 07/07/2026
$269,578
3 Beds
2 Baths
1,851 Sqft
7,838 Lot (sqft)
Sold 06/26/2026
$349,900
$349,900
4 Beds
2 Baths
1,955 Sqft
18,681 Lot (sqft)
Sold 10/18/2026
$287,000
$287,000
3 Beds
2 Baths
1,742 Sqft
7,198 Lot (sqft)
Sold 10/18/2026
$253,201
$253,201
3 Beds
2 Baths
1,958 Sqft
7,198 Lot (sqft)
Sold 10/13/2026
$250,199
$250,199
3 Beds
2 Baths
1,786 Sqft
8,918 Lot (sqft)
Sold 10/13/2026
$304,000
$304,000
3 Beds
2 Baths
1,929 Sqft
9,443 Lot (sqft)
Sold 10/05/2026