Member Features
Find Real Estate Bargain!
Full foreclosure details
Home value, equity and ownership info
Find homes priced below market
Get full access with a FREE Account
Already a member?
$264,900
Listing Price3beds
2baths
1,527sqft
10,019sqft lot
300 Nw 22nd Pl, Cape Coral, FL 33993
Member Features
Find Real Estate Bargain!
Full foreclosure details
Home value, equity and ownership info
Find homes priced below market
Get full access with a FREE Account
Already a member?
For Sale
Sale pending
Off Market
Home type
Price / sqft
Year built
Home Details
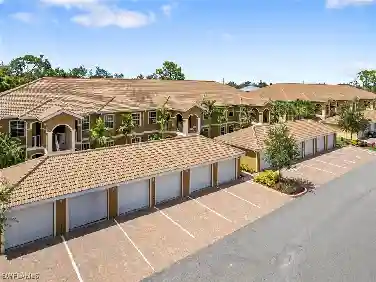
Solid value in NW Cape Coral - a 3-bedroom, 2-bath single-family home built with the upgrades that matter in Southwest Florida. The standout is the metal roof, offering durability and potential insurance advantages that most homes in this price range can't match. Inside, you'll find an upgraded main bathroom, plantation shutters throughout, and updated ceiling fans and lighting fixtures. An automatic sprinkler system keeps the yard maintained, and the garage includes built-in shelving for storage. Clean, move-in ready, and easy to show. Located in the growing NW Cape near shopping, schools, and the Burnt Store corridor, with quick access to Pine Island Road. Property is being sold as-is; refrigerator, washer, and dryer are not included. Sale is subject to third-party approval by seller's lender. Priced to sell - an opportunity for buyers who want a well-kept home with big-ticket items already handled. THIRD PARTY PROCESSOR REQUIRED. SEE ATTACHED DISCLOSURES THAT MUST BE SIGNED AND PRESENTED WITH ALL OFFERS.
Interior Details
1527
3
2
Has Heating:
Yes
Heating Type:
Forced Air With Air Conditioning
Has Cooling:
Yes
Cooling Type:
Central
Has Fuel:
Yes
Fuel Type:
Electric
Has Basement:
No
Basement Type:
N/A
Has Flooring:
No
Flooring Type:
Tile (unspecified)
Has Fireplace:
Yes
Fireplace Type:
N/A
Property Details
10019
No
No
Type:
Garage, Attached
Location:
N/A
Status:
N/A
Number of Spaces:
2
No
No
No
No
No
No
No
Construction Details
Ranch
Concrete Block
N/A
Hip
Asphalt
Tax History
Year
Amount
Land
Improvement
Percent Change
Assessment
2020
$1,224
$0
$0
--%
$78,269
2019
$1,172
$0
$0
--%
$76,509
2018
$1,148
$0
$0
--%
$75,082
2017
$1,119
$0
$0
--%
$70,222
2016
$1,079
$0
$0
--%
$68,778
2014
$1,097
$0
$0
--%
$96,510
2013
$886
$0
$0
--%
$84,596
2012
$848
$0
$0
--%
$70,007

Average Home Price in 33993
Nearby Properties
Zip Code
Price
Bed
Bath
Sqft
Lot
Sold Date
$293,592
$293,592
3 Beds
2 Baths
1,628 Sqft
10,629 Lot (sqft)
Sold 05/25/2026
$322,503
$322,503
3 Beds
2 Baths
1,490 Sqft
10,629 Lot (sqft)
Sold 10/05/2026
$314,900
$314,900
3 Beds
2 Baths
1,702 Sqft
10,019 Lot (sqft)
Sold 10/27/2026
$345,000
$345,000
3 Beds
2 Baths
1,465 Sqft
11,064 Lot (sqft)
Sold 10/26/2026
$255,012
$255,012
4 Beds
2 Baths
1,401 Sqft
10,019 Lot (sqft)
Sold 10/27/2026
$318,000
3 Beds
2 Baths
1,688 Sqft
10,759 Lot (sqft)
Sold 10/27/2026
$345,000
$345,000
3 Beds
2 Baths
1,362 Sqft
10,019 Lot (sqft)
Sold 10/27/2026
$365,000
$365,000
3 Beds
2 Baths
1,669 Sqft
10,019 Lot (sqft)
Sold 11/02/2026
$267,500
$267,500
3 Beds
2 Baths
1,479 Sqft
10,019 Lot (sqft)
Sold 10/27/2026