Omaha Real Estate Market Thrives Amidst Fluctuations – A Look At Early 2023 to 2024 Trends
Omaha’s real estate market displayed significant activity with a seasonal peak in sold properties and fluctuations in property values and demand, alongside notable price differences between Douglas and Sarpy Counties and varied trends in nearby cities, indicating a dynamic and diverse housing market


Key Takeaways
- Omaha sold its most properties in January 2024, at 4,906.
- Omaha's average sold price is approximately $230,293, with a median of about $172 per square foot.
- Douglas County consistently has a higher median price per square foot than Sarpy County.
- The median list price is $284k.
In Omaha, January 2024 saw the highest number of sold properties at 4906, hinting at a possible seasonal market peak, while November 2023 recorded the highest property count at 605. Conversely, January 2024 had the lowest number of properties available at 459. Understanding these fluctuations can help sellers and buyers make well-informed decisions on when to enter the market.
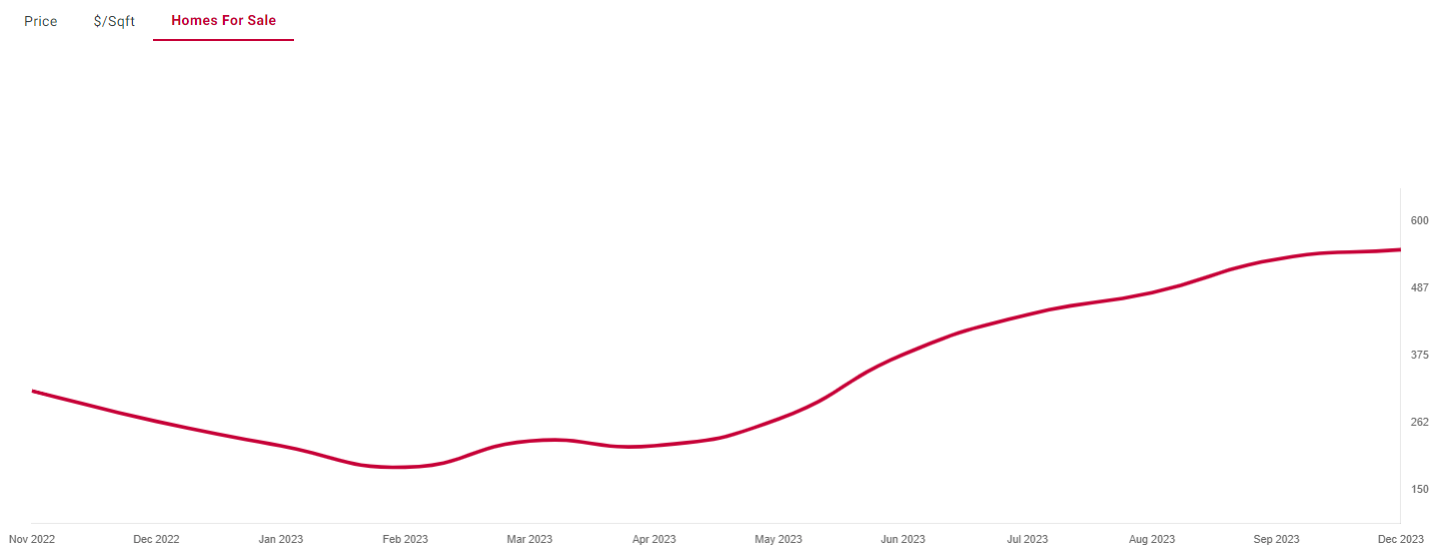
Throughout 2023, Omaha, NE experienced fluctuations in property values and demand by month. Notably, the average sold price for the region is currently approximately $230,293, and the median price per square foot is up to around $172, providing a range of options for buyers with different budgets.
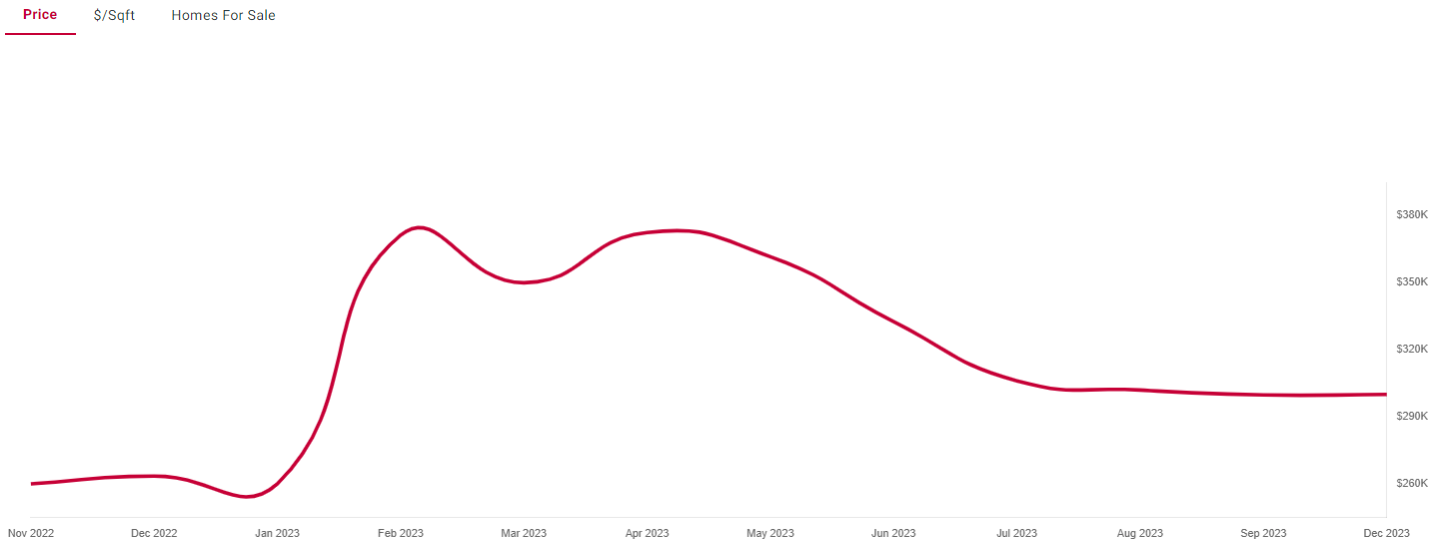
In recent months, specifically from August 2023 to January 2024, we’ve noticed an slight upward trend: despite a slight average sold price decrease in January 2024, the median sold price per square foot has been gradually increasing. This discrepancy might be due to the type of properties sold – perhaps smaller, higher-quality properties are more in demand now, pushing up the price per square foot.
Moreover, there was a noticeable difference in property prices between Douglas County and Sarpy County. On average, Douglas County has higher property values per square foot, signifying potentially higher property values or higher demand. Only in June and July 2023 did Sarpy County’s median sold prices drop slightly below Douglas County, showing that the latter generally has a higher property value trend.
However, median sold prices are not all there is to property value. The median price per square foot consistently sits higher in Douglas County, hinting at a market in which property value, and possibly the density of amenities and services, are concentrated into smaller spaces.
Property Trends in Nearby Cities
Honing in on nearby cities, our data shows substantial variation amongst them. West Point, NE, despite a wide range of median values, maintains a stable median sold price per square foot. This stability implies consistent property type and size offerings throughout the period under review.
On the other hand, Yutan and Waterloo depict substantial price fluctuations. Yutan, NE, demonstrates a significant swing in median sold prices, peaking in December 2023 at $395,000 and dropping to its lowest in November 2023 at $229,275. Waterloo, NE, stands out as the most lucrative market with high median values and price per square foot. September 2023 recorded the highest median sold price per square foot at a staggering $316.
Overall Market Data
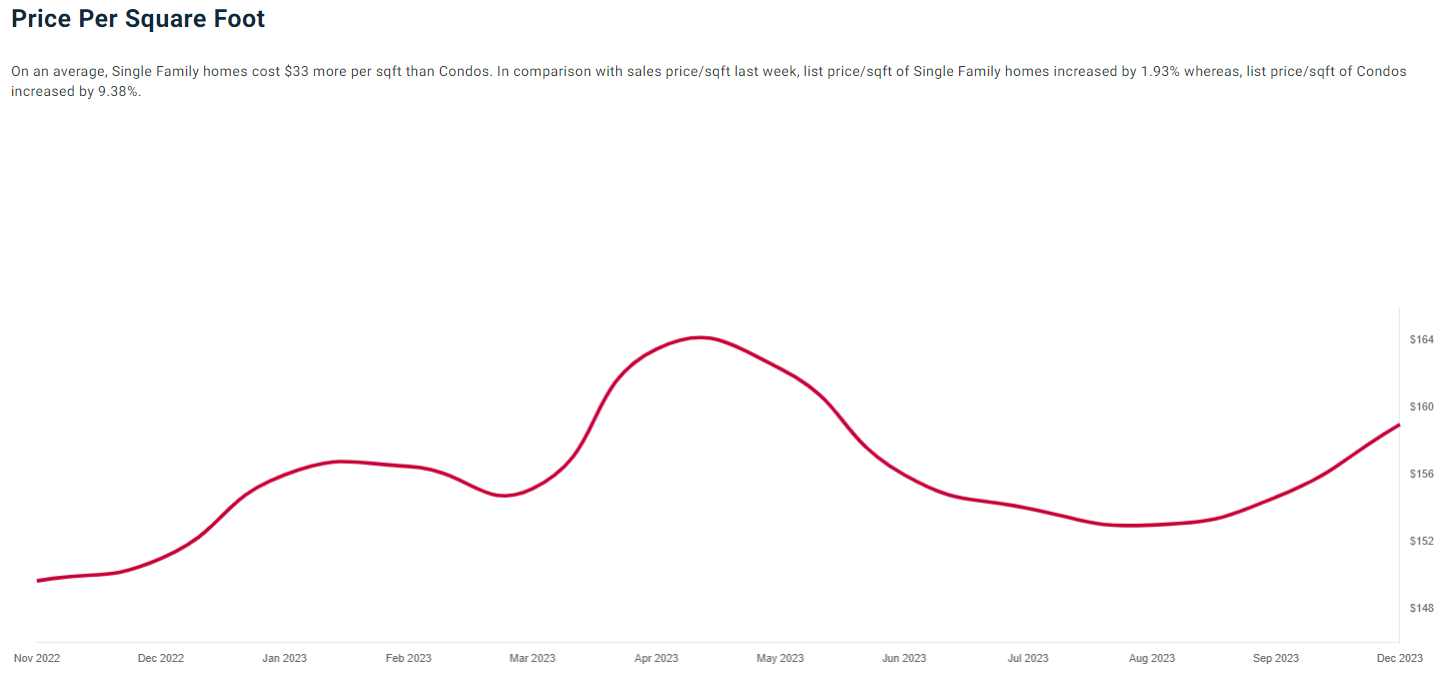
Taking into account the entire market, ~80% of properties are currently active and up for sale, with a relatively high median list price of $284k. These properties typically offer a slightly lower median list price per square foot ($159) compared to the region’s average sold price per square foot. This price point might attract buyers who favor larger properties and are willing to invest in quality improvements.
Frequently Asked Questions
What is the average sold price in Omaha?
Approximately $230,293, with a median price per square foot of around $172.
Which market near Omaha has the highest price per square foot?
Waterloo, which recorded a median sold price per square foot of $316 in September 2023.

About the author: Manuel Martinez
RealtyTrac contributor
Manuel Martinez is a contributor to RealtyTrac who writes about local housing markets, home buying and real estate investing. He has written for RealtyTrac since 2013, covering city and state market reports, home buying guides and tips, investment financing and strategies for buying and flipping homes.
More in Market Reports
Member Features
Find Real Estate Bargain!
Full foreclosure details
Home value, equity and ownership info
Find homes priced below market
Get full access with a FREE Account
Already a member?
Useful Calculators
- Home Affordability CalculatorThe price range your income and debts support under the 28/36 rule.
- Rent vs. Buy CalculatorThe total cost of owning versus renting over your time in the home.
- Rental Property ROI CalculatorCash flow, NOI, cap rate and cash-on-cash return for a rental.