Member Features
Find Real Estate Bargain!
Full foreclosure details
Home value, equity and ownership info
Find homes priced below market
Get full access with a FREE Account
Already a member?
$645,000
Listing Price3beds
2baths
2,102sqft
26,500sqft lot
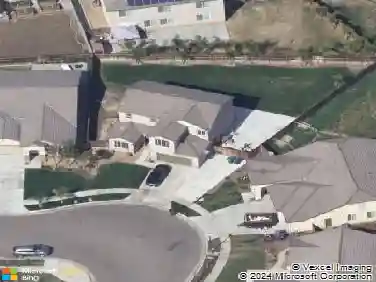
560 Trout Lake Dr, Sanger, CA 93657
Member Features
Find Real Estate Bargain!
Full foreclosure details
Home value, equity and ownership info
Find homes priced below market
Get full access with a FREE Account
Already a member?
For Sale
Home type
Price / sqft
Year built
Home Details
Interior Details
2102
3
2
Has Heating:
No
Heating Type:
N/A
Has Cooling:
Yes
Cooling Type:
Refrigerator
Has Fuel:
No
Fuel Type:
N/A
Has Basement:
No
Basement Type:
N/A
Has Flooring:
No
Flooring Type:
N/A
Has Fireplace:
Yes
Fireplace Type:
N/A
Property Details
26500
No
No
Type:
N/A
Location:
N/A
Status:
N/A
Number of Spaces:
N/A
N/A
N/A
N/A
N/A
N/A
N/A
N/A
Construction Details
L-shape
N/A
N/A
N/A
N/A
Tax History
Year
Amount
Land
Improvement
Percent Change
Assessment
2020
$3,580
$79,047
$147,183
--%
$226,230
2019
$3,510
$77,498
$144,298
--%
$221,796
2018
$3,382
$75,979
$141,469
--%
$217,448
2017
$3,293
$74,490
$138,696
--%
$213,186
2016
$3,131
$73,030
$135,977
--%
$209,007
2014
$3,884
$70,525
$131,312
--%
$201,837
2013
$2,912
$70,207
$130,719
--%
$200,926
2012
$2,676
$68,831
$128,156
--%
$196,987

Average Home Price in 93657
Nearby Properties
Zip Code
Price
Bed
Bath
Sqft
Lot
Sold Date
$623,855
$623,855
2 Beds
2 Baths
2,348 Sqft
57,500 Lot (sqft)
Sold 10/20/2026
$532,532
$532,532
3 Beds
2 Baths
1,792 Sqft
14,280 Lot (sqft)
Sold 09/30/2026
$567,542
$567,542
3 Beds
2 Baths
1,840 Sqft
22,575 Lot (sqft)
Sold 06/11/2026
$759,205
$759,205
3 Beds
2 Baths
1,818 Sqft
26,215 Lot (sqft)
Sold 10/27/2026
$791,527
$791,527
3 Beds
2.5 Baths
1,972 Sqft
15,120 Lot (sqft)
Sold 10/26/2026
Calculators
Mortgage
Mortgage Calculator
Details for 560 TROUT LAKE DR
Property Debt
Foreclosure Contact Details
Similar Homes Nearby

Guides for Trout Lake Dr

The real estate market in Fresno and its neighboring cities has shown robust growth from April 2023 to March 2024, with increasing property values, healthy sales volumes, and some location-specific fluctuations.