Member Features
Find Real Estate Bargain!
Full foreclosure details
Home value, equity and ownership info
Find homes priced below market
Get full access with a FREE Account
Already a member?
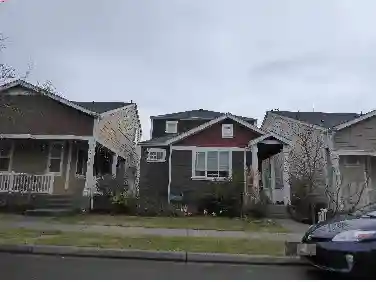
$538,745
Est. Value3beds
2baths
1,869sqft
6,970sqft lot
5913 Thornbury Dr Se, Lacey, WA 98513
Member Features
Find Real Estate Bargain!
Full foreclosure details
Home value, equity and ownership info
Find homes priced below market
Get full access with a FREE Account
Already a member?
Off Market
Home type
Price / sqft
Year built
Home Details
Interior Details
1869
3
2
Has Heating:
Yes
Heating Type:
Heat Pump
Has Cooling:
Yes
Cooling Type:
N/A
Has Fuel:
Yes
Fuel Type:
Gas
Has Basement:
No
Basement Type:
No Basement
Has Flooring:
No
Flooring Type:
Carpet
Has Fireplace:
Yes
Fireplace Type:
Yes
Property Details
6970
Yes
Yes
Type:
Garage, Attached
Location:
N/A
Status:
N/A
Number of Spaces:
2
No
No
No
No
Yes
No
No
Construction Details
Ranch
Aluminum/vinyl
N/A
Hip
Composition Shingle
Tax History
Year
Amount
Land
Improvement
Percent Change
Assessment
2020
$4,008
$84,300
$267,700
--%
$352,000
2020
$4,008
$70,500
$263,000
--%
$333,500
2019
$3,270
$64,900
$234,200
--%
$299,100
2018
$3,584
$55,600
$211,400
--%
$267,000
2017
$3,260
$51,950
$203,900
--%
$255,850
2015
$2,909
$48,600
$174,000
--%
$222,600
2014
$2,659
$48,600
$161,700
--%
$210,300
2012
$2,427
$44,950
$137,600
--%
$182,550
Average Home Price in 98513
Nearby Properties
Zip Code
Price
Bed
Bath
Sqft
Lot
Sold Date
$495,000
$495,000
3 Beds
2 Baths
1,647 Sqft
9,583 Lot (sqft)
Sold 04/08/2024
$456,930
$456,930
3 Beds
3 Baths
1,630 Sqft
6,534 Lot (sqft)
Sold 02/29/2024
$466,394
$466,394
3 Beds
3 Baths
1,888 Sqft
3,049 Lot (sqft)
Sold 02/28/2024
$471,767
$471,767
4 Beds
3 Baths
1,720 Sqft
3,049 Lot (sqft)
Sold 02/21/2024
$538,533
$538,533
3 Beds
3 Baths
2,016 Sqft
6,098 Lot (sqft)
Sold 02/09/2024
$501,851
$501,851
4 Beds
2 Baths
1,604 Sqft
10,019 Lot (sqft)
Sold 12/01/2023
$488,293
$488,293
3 Beds
3 Baths
1,865 Sqft
6,970 Lot (sqft)
Sold 11/27/2023
$470,595
$470,595
3 Beds
3 Baths
1,847 Sqft
6,098 Lot (sqft)
Sold 11/01/2023
$399,900
$399,900
3 Beds
3 Baths
1,974 Sqft
6,534 Lot (sqft)
Sold 06/07/2021
Calculators
Mortgage
Mortgage Calculator
Details for 5913 THORNBURY DR SE

Property Debt

Foreclosure Contact Details