Member Features
Find Real Estate Bargain!
Full foreclosure details
Home value, equity and ownership info
Find homes priced below market
Get full access with a FREE Account
Already a member?
$470,439
Sold Price3beds
2baths
2,475sqft
11,238sqft lot
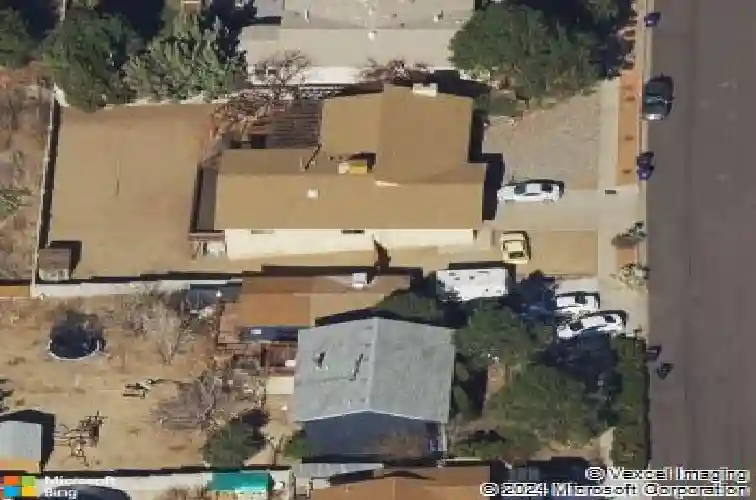
735 Supper Rock Dr Ne, Albuquerque, NM 87123
Member Features
Find Real Estate Bargain!
Full foreclosure details
Home value, equity and ownership info
Find homes priced below market
Get full access with a FREE Account
Already a member?
Recently Sold
Off Market
Home type
Price / sqft
Year built
Home Details
Interior Details
2475
3
2
Has Heating:
No
Heating Type:
N/A
Has Cooling:
No
Cooling Type:
N/A
Has Fuel:
Yes
Fuel Type:
Gas
Has Basement:
No
Basement Type:
No Basement
Has Flooring:
No
Flooring Type:
Carpet
Has Fireplace:
Yes
Fireplace Type:
N/A
Property Details
11238
No
No
Type:
N/A
Location:
N/A
Status:
N/A
Number of Spaces:
N/A
N/A
N/A
N/A
N/A
N/A
N/A
N/A
Construction Details
N/A
N/A
N/A
Flat
Shingle
Tax History
Year
Amount
Land
Improvement
Percent Change
Assessment
2020
$3,665
$27,631
$59,827
--%
$87,458
2019
$3,664
$27,631
$59,827
--%
$87,458
2018
$3,670
$27,631
$63,827
--%
$91,458
2017
$4,089
$27,631
$70,526
--%
$98,157
2016
$3,604
$28,459
$56,267
--%
$84,726
2014
$3,519
$27,631
$55,261
--%
$82,892
2012
$2,792
$43,054
$162,178
--%
$205,232

Average Home Price in 87123
Nearby Properties
Zip Code
Price
Bed
Bath
Sqft
Lot
Sold Date
$554,093
$554,093
3 Beds
2.5 Baths
2,421 Sqft
8,233 Lot (sqft)
Sold 10/18/2026
$469,344
3 Beds
2 Baths
2,192 Sqft
16,248 Lot (sqft)
Sold 10/13/2026
Calculators
Mortgage
Mortgage Calculator
Details for 735 SUPPER ROCK DR NE
Property Debt
Foreclosure Contact Details
Similar Homes Nearby

Guides for Supper Rock Dr

The article explores the nuances of Albuquerque’s real estate market trends, highlighting increasing property values, fluctuating price per square foot, a nearby cities.