Member Features
Find Real Estate Bargain!
Full foreclosure details
Home value, equity and ownership info
Find homes priced below market
Get full access with a FREE Account
Already a member?
$719,900
Listing Price3beds
2baths
1,107sqft
8,938sqft lot
4832 Olive St, Montclair, CA 91763
Member Features
Find Real Estate Bargain!
Full foreclosure details
Home value, equity and ownership info
Find homes priced below market
Get full access with a FREE Account
Already a member?
For Sale
Off Market
Home type
Price / sqft
Year built
Home Details
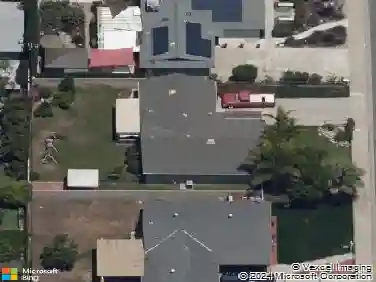
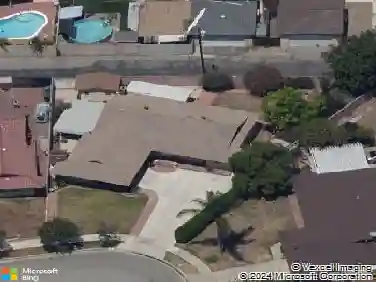
Discover this beautifully renovated 3-bedroom, 2-bath home nestled in a charming Montclair neighborhood just minutes from the heart of Claremont. Located only 2 miles from the prestigious Claremont Colleges and the vibrant Village, this move-in ready property offers the perfect blend of convenience and modern comfort. Enjoy a newly updated kitchen and bathrooms, new flooring throughout, a brand new HVAC system, fresh interior and exterior paint, and an indoor laundry room. The home also features a spacious two-car attached garage and a generous lot with ample potential for expansion, outdoor entertaining, or the addition of an ADU. All major shopping, dining, and everyday amenities are just moments away, with incredibly convenient freeway access for commuters. This is an exceptional opportunity you do not want to miss.
Interior Details
1107
3
2
Has Heating:
Yes
Heating Type:
Floor/wall Furnace
Has Cooling:
Yes
Cooling Type:
Evaporative
Has Fuel:
No
Fuel Type:
N/A
Has Basement:
No
Basement Type:
N/A
Has Flooring:
No
Flooring Type:
N/A
Has Fireplace:
Yes
Fireplace Type:
N/A
Property Details
8938
Yes
Yes
Type:
Garage, Attached
Location:
N/A
Status:
N/A
Number of Spaces:
2
No
Yes
No
No
No
No
No
Construction Details
Modern
Block
N/A
N/A
Composition Shingle
Tax History
Year
Amount
Land
Improvement
Percent Change
Assessment
2020
$1,651
$52,503
$96,259
--%
$148,762
2019
$1,637
$51,474
$94,372
--%
$145,846
2018
$1,614
$50,465
$92,522
--%
$142,987
2017
$1,557
$49,475
$90,708
--%
$140,183
2016
$1,496
$48,505
$88,929
--%
$137,434
2014
$1,439
$46,840
$85,877
--%
$132,717
2013
$1,453
$46,628
$85,489
--%
$132,117
2012
$1,374
$45,714
$83,813
--%
$129,527

Average Home Price in 91763
Nearby Properties
Zip Code
Price
Bed
Bath
Sqft
Lot
Sold Date
$670,299
$670,299
3 Beds
2 Baths
1,228 Sqft
7,236 Lot (sqft)
Sold 10/08/2026
$515,834
2 Beds
1 Baths
948 Sqft
7,200 Lot (sqft)
Sold 07/25/2026
$623,715
$623,715
3 Beds
2 Baths
1,196 Sqft
7,210 Lot (sqft)
Sold 10/13/2026
$632,232
$632,232
2 Beds
1 Baths
948 Sqft
7,839 Lot (sqft)
Sold 10/13/2026
$568,810
$568,810
2 Beds
1 Baths
1,014 Sqft
7,705 Lot (sqft)
Sold 10/13/2026
$647,875
$647,875
3 Beds
2 Baths
1,228 Sqft
7,208 Lot (sqft)
Sold NaN/NaN/NaN
$749,900
$749,900
3 Beds
1 Baths
1,164 Sqft
11,088 Lot (sqft)
Sold 10/18/2026
Calculators
Mortgage
Mortgage Calculator
Details for 4832 OLIVE ST
Property Debt
Foreclosure Contact Details
Similar Homes Nearby

Guides for Olive St

San Bernardino’s real estate values rose steadily in early to mid-2024, with average property values peaking at $500K in May. Sale prices per sq. ft also increased modestly despite a subtle decrease in number of properties sold. Comparison with nearby cities shows varied market trends.