Member Features
Find Real Estate Bargain!
Full foreclosure details
Home value, equity and ownership info
Find homes priced below market
Get full access with a FREE Account
Already a member?
$742,092
Est. Value2beds
2baths
1,258sqft
31,392sqft lot
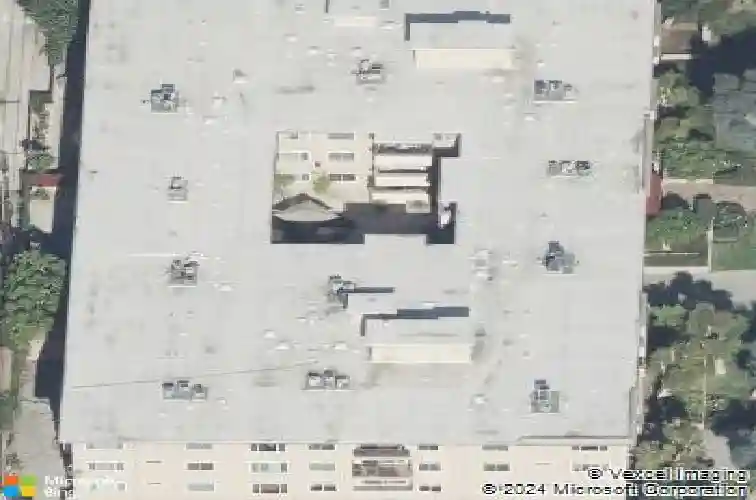
1121 N Olive Dr, West Hollywood, CA 90069
Member Features
Find Real Estate Bargain!
Full foreclosure details
Home value, equity and ownership info
Find homes priced below market
Get full access with a FREE Account
Already a member?
Off Market
Home type
Price / sqft
Year built
Home Details
Interior Details
1258
2
2
Has Heating:
Yes
Heating Type:
Central
Has Cooling:
Yes
Cooling Type:
Central
Has Fuel:
No
Fuel Type:
N/A
Has Basement:
No
Basement Type:
N/A
Has Flooring:
No
Flooring Type:
N/A
Has Fireplace:
Yes
Fireplace Type:
N/A
Property Details
31392
Yes
Yes
Type:
N/A
Location:
N/A
Status:
N/A
Number of Spaces:
N/A
N/A
N/A
N/A
N/A
N/A
N/A
N/A
Construction Details
Contemporary
Stucco
N/A
N/A
Builtup (layered Asphalt)
Tax History
Year
Amount
Land
Improvement
Percent Change
Assessment
2019
$8,267
$544,929
$155,466
--%
$700,395
2019
$8,267
$534,245
$152,418
--%
$686,663
2018
$8,206
$523,770
$149,430
--%
$673,200
2017
$8,039
$513,500
$146,500
--%
$660,000
2016
$7,002
$429,928
$136,997
--%
$566,925
2014
$6,891
$415,176
$132,297
--%
$547,473
2013
$2,658
$99,522
$99,522
--%
$199,044
2012
$2,578
$97,571
$97,571
--%
$195,142

Average Home Price in 90069
Nearby Properties
Zip Code
Price
Bed
Bath
Sqft
Lot
Sold Date
$1,295,719
$1,295,719
2 Beds
2 Baths
1,410 Sqft
15,146 Lot (sqft)
Sold 10/14/2026
$662,052
1 Beds
2 Baths
1,073 Sqft
39,994 Lot (sqft)
Sold 10/02/2026
$1,015,326
$1,015,326
1 Beds
2 Baths
1,200 Sqft
30,496 Lot (sqft)
Sold 09/25/2026
$875,000
1 Beds
2 Baths
1,200 Sqft
30,496 Lot (sqft)
Sold 09/25/2026
$700,000
2 Beds
2 Baths
1,351 Sqft
84,581 Lot (sqft)
Sold 09/25/2026
$669,817
2 Beds
2 Baths
1,152 Sqft
25,856 Lot (sqft)
Sold 09/25/2026
$899,000
2 Beds
2 Baths
1,306 Sqft
47,398 Lot (sqft)
Sold 09/25/2026
$786,780
2 Beds
2 Baths
1,238 Sqft
16,152 Lot (sqft)
Sold 09/22/2026
$1,000,000
2 Beds
2 Baths
1,137 Sqft
62,464 Lot (sqft)
Sold 09/22/2026
Calculators
Mortgage
Mortgage Calculator
Details for 1121 N OLIVE DR
Property Debt
Foreclosure Contact Details
Similar Homes Nearby
Guides for Olive Dr

In August 2024, LA’s pre-foreclosures plummeted 50% from July and 60% from last year, suggesting better economic conditions or successful homeowner interventions. Similar trends in San Jose, while SF and SD remain stable. Sacramento shows significant improvement. LA’s efforts stand out. #HousingMarket #LosAngeles