
Member Features
Find Real Estate Bargain!
Full foreclosure details
Home value, equity and ownership info
Find homes priced below market
Get full access with a FREE Account
Already a member?
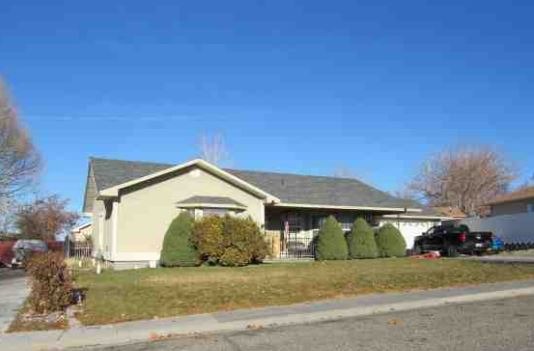
$392,250
Est. Value$222,455Est. Opening Bid3beds
2baths
1,854sqft
9,148sqft lot
1673 Midas Dr, Winnemucca, NV 89445
Member Features
Find Real Estate Bargain!
Full foreclosure details
Home value, equity and ownership info
Find homes priced below market
Get full access with a FREE Account
Already a member?
Auction
New Listing
Off Market
Home type
Price / sqft
Year built
Home Details
Interior Details
1854
3
2
Has Heating:
Yes
Heating Type:
Yes
Has Cooling:
Yes
Cooling Type:
N/A
Has Fuel:
No
Fuel Type:
N/A
Has Basement:
No
Basement Type:
No Basement
Has Flooring:
No
Flooring Type:
N/A
Has Fireplace:
No
Fireplace Type:
N/A
Property Details
9148
No
No
Type:
N/A
Location:
N/A
Status:
N/A
Number of Spaces:
N/A
N/A
N/A
N/A
N/A
N/A
N/A
N/A
Construction Details
N/A
Stucco
N/A
Gable
Composition Shingle
Tax History
Year
Amount
Land
Improvement
Percent Change
Assessment
2020
$2,527
$9,275
$66,999
--%
$76,274
2019
$2,449
$9,275
$64,563
--%
$73,838
2018
$2,438
$9,275
$64,205
--%
$73,480
2017
$2,436
$9,275
$64,129
--%
$73,404
2016
$2,481
$9,275
$65,565
--%
$74,840
2014
$2,451
$9,275
$64,625
--%
$73,900
2013
$2,402
$9,275
$63,071
--%
$72,346
2012
$2,446
$11,025
$63,129
--%
$74,154
Average Home Price in 89445
Nearby Properties
Zip Code
Price
Bed
Bath
Sqft
Lot
Sold Date
$324,823
3 Beds
2 Baths
1,892 Sqft
13,068 Lot (sqft)
Sold 04/15/2024
$392,250
$392,250
3 Beds
2 Baths
1,854 Sqft
9,148 Lot (sqft)
Sold NaN/NaN/NaN
$380,000
$380,000
5 Beds
2 Baths
2,080 Sqft
7,841 Lot (sqft)
Sold 03/22/2024
$424,900
3 Beds
2.5 Baths
1,727 Sqft
10,454 Lot (sqft)
Sold 03/18/2024
$409,000
$409,000
3 Beds
2 Baths
1,718 Sqft
10,019 Lot (sqft)
Sold 03/21/2024
Calculators
Mortgage
Mortgage Calculator
Auction Details for 1673 MIDAS DR

Property Debt

Foreclosure Contact Details

Current Owner
Transaction History
Similar Homes Nearby


Guides for Midas Dr

Reno’s real estate market shows shifting trends for property values and average sale prices, with notable discrepancies in listing volumes and properties sold, suggesting a fluid market for potential investors.


