Member Features
Find Real Estate Bargain!
Full foreclosure details
Home value, equity and ownership info
Find homes priced below market
Get full access with a FREE Account
Already a member?
$239,564
Listing Price3beds
2.5baths
1,392sqft
12,079sqft lot
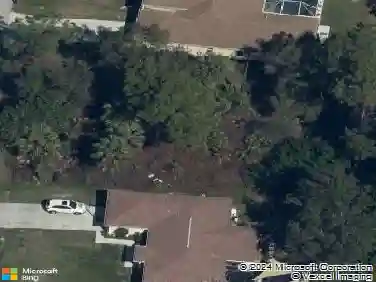
5993 Mayberry Ave, North Port, FL 34287
Member Features
Find Real Estate Bargain!
Full foreclosure details
Home value, equity and ownership info
Find homes priced below market
Get full access with a FREE Account
Already a member?
For Sale
Off Market
Home type
Price / sqft
Year built
Home Details
Back on Market!! Buyer fell through. Welcome to this GORGEOUS RENOVATED HOME!! ~~Recent Key Updates in the home include ~~ New Plumbing, NEW ROOF (6 Months old!!), New Lights/Ceiling Fans, New Bathroom Vanities, HURRICANE WINDOWS AND SLIDING DOORS (2018), New Kitchen Countertops, Appliances, FRESHLY painted Inside and Out. This home has an amazing OVERSIZED LOT, one car GARAGE, and is on City Water and Sewer. This spacious split floor plan with seperate Living and Family room space for AMPLE entertaining and storage. Back Yard space is so large you could host a concert!!The Many upgraded windows throughout the home produce a bright sunny interior! Bedroom #2 and #3 each has a separate lavatory with shared bathtub. Great location, Close to MINERAL SPRINGS, close to 41 and all the new shopping centers! No Carpet! Tile Through the house! Older but functional A/C, Priced to Sell!!nnSchedule your Showing today, This home, with these extras, at this price....will not last long!!
Interior Details
1392
3
2.5
Has Heating:
Yes
Heating Type:
Central
Has Cooling:
Yes
Cooling Type:
Central
Has Fuel:
No
Fuel Type:
N/A
Has Basement:
No
Basement Type:
N/A
Has Flooring:
No
Flooring Type:
Ceramic Tile
Has Fireplace:
Yes
Fireplace Type:
N/A
Property Details
12079
Yes
Yes
Type:
Garage, Attached
Location:
N/A
Status:
N/A
Number of Spaces:
1
No
No
No
No
Yes
No
No
Construction Details
N/A
Stucco
N/A
Hip
Asphalt
Tax History
Year
Amount
Land
Improvement
Percent Change
Assessment
2020
$2,829
$29,100
$109,500
--%
$138,600
2019
$2,652
$26,100
$102,000
--%
$128,100
2018
$2,407
$21,000
$99,500
--%
$120,500
2017
$2,270
$13,400
$97,300
--%
$110,700
2016
$1,733
$7,500
$75,200
--%
$82,700
2014
$1,466
$0
$0
--%
$56,210
2013
$1,354
$0
$0
--%
$51,100
2012
$1,267
$0
$0
--%
$47,900

Average Home Price in 34287
Nearby Properties
Zip Code
Price
Bed
Bath
Sqft
Lot
Sold Date
$219,257
$219,257
3 Beds
2 Baths
1,315 Sqft
11,572 Lot (sqft)
Sold 10/22/2026
$208,257
$208,257
3 Beds
2 Baths
1,237 Sqft
10,000 Lot (sqft)
Sold 10/14/2026
$230,289
3 Beds
2 Baths
1,244 Sqft
13,125 Lot (sqft)
Sold 09/01/2026
$213,863
$213,863
3 Beds
2 Baths
1,573 Sqft
14,233 Lot (sqft)
Sold 07/07/2026
$172,201
3 Beds
2 Baths
1,222 Sqft
7,500 Lot (sqft)
Sold 10/13/2026
$269,900
$269,900
3 Beds
2 Baths
1,238 Sqft
10,000 Lot (sqft)
Sold 10/13/2026
$204,999
3 Beds
2 Baths
1,229 Sqft
21,445 Lot (sqft)
Sold 10/18/2026
$225,000
$225,000
3 Beds
1.5 Baths
1,193 Sqft
7,726 Lot (sqft)
Sold 10/26/2026
$190,723
$190,723
3 Beds
2 Baths
1,271 Sqft
10,000 Lot (sqft)
Sold 10/13/2026