Member Features
Find Real Estate Bargain!
Full foreclosure details
Home value, equity and ownership info
Find homes priced below market
Get full access with a FREE Account
Already a member?
$1,200,000
Listing Price--beds
--baths
1,960sqft
51,662sqft lot
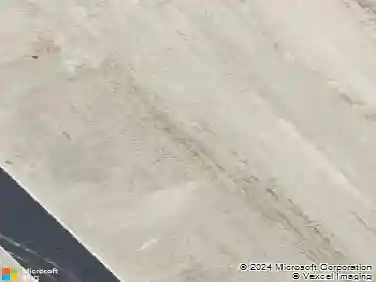
2391 FM 1103, Cibolo, TX 78108
Member Features
Find Real Estate Bargain!
Full foreclosure details
Home value, equity and ownership info
Find homes priced below market
Get full access with a FREE Account
Already a member?
For Sale
Off Market
Home type
Price / sqft
Year built
Home Details
This commercial property is located on the hard corner of FM 1103 & Green Valley Rd in the rapidly developing community of Cibolo, TX. The City of Cibolo is experiencing strong economic growth with increased retail development and the construction of future single-family homes. The subject tract is well-positioned at a four-way signalized intersection surrounded by retail and professional services. In addition, FM 1103 is currently scheduled to be expanded to 4 lanes to accommodate the future and surrounding developments.
Interior Details
1960
N/A
N/A
Has Heating:
No
Heating Type:
N/A
Has Cooling:
No
Cooling Type:
N/A
Has Fuel:
No
Fuel Type:
N/A
Has Basement:
No
Basement Type:
N/A
Has Flooring:
No
Flooring Type:
N/A
Has Fireplace:
Yes
Fireplace Type:
N/A
Property Details
51662
Yes
No
Type:
Garage, Detached
Location:
N/A
Status:
N/A
Number of Spaces:
8
N/A
N/A
N/A
N/A
N/A
N/A
N/A
Construction Details
N/A
N/A
N/A
N/A
N/A
Tax History
Year
Amount
Land
Improvement
Percent Change
Assessment
2020
$7,933
$347,810
$223
--%
$348,033
2019
$6,541
$284,999
$1
--%
$285,000
2018
$8,425
$360,000
$151
--%
$360,151
2017
$11,403
$477,068
$15,051
--%
$492,119
2016
$6,364
$261,372
$15,051
--%
$276,423
2013
$3,457
$133,003
$15,051
--%
$148,054
2013
$3,457
$133,003
$15,051
--%
$148,054
2012
$4,978
$172,384
$47,513
--%
$219,897

Average Home Price in 78108