Member Features
Find Real Estate Bargain!
Full foreclosure details
Home value, equity and ownership info
Find homes priced below market
Get full access with a FREE Account
Already a member?
$399,900
Listing Price3beds
3.5baths
2,406sqft
7,658sqft lot
109 S Canyon Dr, Bolingbrook, IL 60490
Member Features
Find Real Estate Bargain!
Full foreclosure details
Home value, equity and ownership info
Find homes priced below market
Get full access with a FREE Account
Already a member?
For Sale
Off Market
Home type
Price / sqft
Year built
Home Details
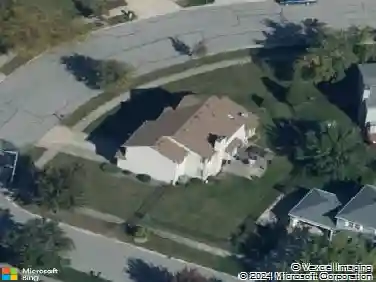
Welcome to this impressive 2-story home in Bolingbrook's sought-after Indian Boundary neighborhood! Vaulted ceilings with skylights flood the main living area with natural light, creating a bright and airy atmosphere from the moment you walk in. The open-concept kitchen features a center island and hardwood floors that flow seamlessly into the dining area-perfect for everyday living and entertaining. With 4 bedrooms, 3 baths, and 2,406 square feet of living space, there's room for everyone. Major recent exterior updates provide added peace of mind, including a newly replaced roof with a 50-year transferable warranty, new skylights with remote-controlled shades, and new gutters. Step outside to a generous deck and fully fenced backyard-your own private retreat all summer long. Conveniently located with easy access to I-55 and I-355, shopping, dining, and everyday amenities. This home truly checks all the boxes. Schedule your showing today! This sale is based on the completion of a prior transaction.
Interior Details
2406
3
3.5
Has Heating:
No
Heating Type:
N/A
Has Cooling:
No
Cooling Type:
N/A
Has Fuel:
No
Fuel Type:
N/A
Has Basement:
No
Basement Type:
N/A
Has Flooring:
No
Flooring Type:
N/A
Has Fireplace:
Yes
Fireplace Type:
N/A
Property Details
7658
No
No
Type:
N/A
Location:
N/A
Status:
N/A
Number of Spaces:
N/A
N/A
N/A
N/A
N/A
N/A
N/A
N/A
Construction Details
N/A
Aluminum/vinyl
N/A
N/A
N/A
Tax History
Year
Amount
Land
Improvement
Percent Change
Assessment
2019
$8,306
$12,923
$73,583
--%
$86,506
2018
$7,976
$12,369
$70,428
--%
$82,797
2017
$8,509
$13,026
$74,165
--%
$87,191
2016
$8,268
$12,400
$70,600
--%
$83,000
2015
$8,163
$11,900
$67,700
--%
$79,600
2013
$6,494
$9,900
$56,400
--%
$66,300
2012
$6,964
$11,400
$65,000
--%
$76,400
2011
$6,804
$12,700
$72,200
--%
$84,900

Average Home Price in 60490
Nearby Properties
Zip Code
Price
Bed
Bath
Sqft
Lot
Sold Date
$402,580
4 Beds
2.5 Baths
2,698 Sqft
21,019 Lot (sqft)
Sold 10/20/2026
$416,750
$416,750
4 Beds
3.5 Baths
2,206 Sqft
7,200 Lot (sqft)
Sold 10/01/2026
$524,800
-- Beds
1.5 Baths
2,267 Sqft
10,347 Lot (sqft)
Sold 09/23/2026
$493,479
4 Beds
3 Baths
2,510 Sqft
9,579 Lot (sqft)
Sold 07/31/2026
$488,312
$488,312
4 Beds
2.5 Baths
2,176 Sqft
11,610 Lot (sqft)
Sold 07/15/2026
$510,069
-- Beds
3 Baths
2,393 Sqft
11,391 Lot (sqft)
Sold 10/18/2026
$429,534
-- Beds
-- Baths
2,275 Sqft
18,503 Lot (sqft)
Sold 10/13/2026
$490,000
$490,000
4 Beds
3 Baths
2,350 Sqft
9,808 Lot (sqft)
Sold 10/13/2026
$450,000
4 Beds
4 Baths
2,176 Sqft
9,375 Lot (sqft)
Sold 09/29/2026