Member Features
Find Real Estate Bargain!
Full foreclosure details
Home value, equity and ownership info
Find homes priced below market
Get full access with a FREE Account
Already a member?
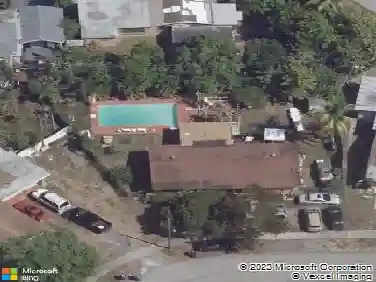
$575,000
Sold Price3beds
2baths
1,717sqft
10,276sqft lot
19711 Nw 39th Ct, Miami Gardens, FL 33055
Member Features
Find Real Estate Bargain!
Full foreclosure details
Home value, equity and ownership info
Find homes priced below market
Get full access with a FREE Account
Already a member?
Recently Sold
Off Market
Home type
Price / sqft
Year built
Home Details
Interior Details
1717
3
2
Has Heating:
No
Heating Type:
None
Has Cooling:
No
Cooling Type:
N/A
Has Fuel:
No
Fuel Type:
N/A
Has Basement:
No
Basement Type:
No Basement
Has Flooring:
No
Flooring Type:
Vinyl/resilient
Has Fireplace:
No
Fireplace Type:
N/A
Property Details
10276
No
No
Type:
Carport (unspecified)
Location:
N/A
Status:
N/A
Number of Spaces:
0
N/A
N/A
N/A
N/A
N/A
N/A
N/A
Construction Details
N/A
Stucco
N/A
N/A
N/A
Tax History
Year
Amount
Land
Improvement
Percent Change
Assessment
2020
$6,846
$117,560
$149,160
--%
$266,720
2019
$6,657
$106,873
$149,983
--%
$256,856
2018
$6,228
$92,486
$150,805
--%
$243,291
2017
$1,990
$0
$0
--%
$102,891
2016
$1,927
$0
$0
--%
$100,775
2014
$1,982
$0
$0
--%
$100,454
2013
$1,878
$0
$0
--%
$98,970
2011
$1,718
$0
$0
--%
$94,482
Average Home Price in 33055
Nearby Properties
Zip Code
Price
Bed
Bath
Sqft
Lot
Sold Date
$467,840
$467,840
3 Beds
2 Baths
1,843 Sqft
7,500 Lot (sqft)
Sold 04/04/2024
$482,032
3 Beds
2 Baths
1,639 Sqft
7,500 Lot (sqft)
Sold 03/13/2024
$416,600
$416,600
3 Beds
2 Baths
1,639 Sqft
10,000 Lot (sqft)
Sold 03/06/2024
$608,337
4 Beds
3 Baths
1,564 Sqft
7,500 Lot (sqft)
Sold 02/23/2024
$627,386
$627,386
4 Beds
2 Baths
1,738 Sqft
5,742 Lot (sqft)
Sold 02/14/2024
$585,805
3 Beds
2 Baths
1,658 Sqft
9,000 Lot (sqft)
Sold 01/15/2024
$575,000
$575,000
3 Beds
2 Baths
1,717 Sqft
10,276 Lot (sqft)
Sold 12/15/2023
$299,000
$299,000
4 Beds
2 Baths
1,652 Sqft
5,699 Lot (sqft)
Sold NaN/NaN/NaN
$527,296
$527,296
4 Beds
2 Baths
1,652 Sqft
5,020 Lot (sqft)
Sold NaN/NaN/NaN
Calculators
Mortgage
Mortgage Calculator
Details for 19711 NW 39TH CT

Property Debt

Foreclosure Contact Details