Member Features
Find Real Estate Bargain!
Full foreclosure details
Home value, equity and ownership info
Find homes priced below market
Get full access with a FREE Account
Already a member?
$476,250
Est. Value$10,617Est. Opening Bid3beds
2baths
1,173sqft
1,295sqft lot
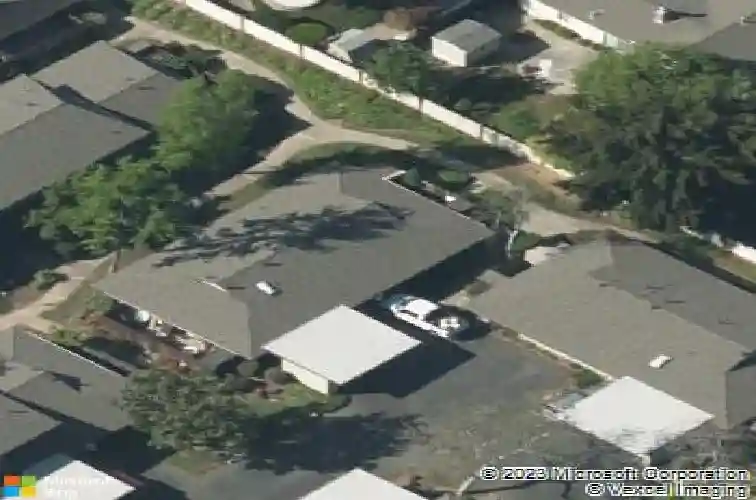
1730 Sapling CT Apt A, Concord, CA 94519
Member Features
Find Real Estate Bargain!
Full foreclosure details
Home value, equity and ownership info
Find homes priced below market
Get full access with a FREE Account
Already a member?
Pre-Foreclosure
Off Market
Home type
Price / sqft
Year built
Home Details
Interior Details
1173
3
2
Has Heating:
No
Heating Type:
None
Has Cooling:
Yes
Cooling Type:
Central
Has Fuel:
No
Fuel Type:
N/A
Has Basement:
No
Basement Type:
No Basement
Has Flooring:
No
Flooring Type:
N/A
Has Fireplace:
No
Fireplace Type:
N/A
Property Details
1295
No
No
Type:
N/A
Location:
N/A
Status:
N/A
Number of Spaces:
N/A
N/A
N/A
N/A
N/A
N/A
N/A
N/A
Construction Details
N/A
N/A
N/A
N/A
N/A
Tax History
Year
Amount
Land
Improvement
Percent Change
Assessment
2020
$5,422
$287,800
$124,360
--%
$412,160
2019
$5,412
$280,000
$136,000
--%
$416,000
2018
$1,924
$28,421
$91,541
--%
$119,962
2017
$1,839
$27,864
$89,747
--%
$117,611
2016
$1,822
$27,318
$87,988
--%
$115,306
2014
$1,636
$26,381
$84,970
--%
$111,351
2013
$1,569
$26,262
$84,586
--%
$110,848
2012
$1,467
$25,748
$82,928
--%
$108,676
Average Home Price in 94519
Nearby Properties
Zip Code
Price
Bed
Bath
Sqft
Lot
Sold Date
$429,000
$429,000
2 Beds
1 Baths
1,015 Sqft
741 Lot (sqft)
Sold 03/18/2024
$498,500
$498,500
3 Beds
2 Baths
1,296 Sqft
1,711 Lot (sqft)
Sold 11/23/2023
$408,000
$408,000
3 Beds
2 Baths
1,173 Sqft
1,260 Lot (sqft)
Sold 11/01/2019
$476,250
$476,250
3 Beds
2 Baths
1,173 Sqft
1,295 Lot (sqft)
Sold NaN/NaN/NaN
Calculators
Mortgage
Mortgage Calculator
Pre-Foreclosure Details for 1730 SAPLING CT APT A

Property Debt

Foreclosure Contact Details

Current Owner
Transaction History
Similar Homes Nearby


Guides for Sapling Ct

This blog post discusses the dynamic real estate trends in Bakersfield, noting fluctuations in property values, sale prices, and activity levels. It also highlights differences in nearby cities, showcasing diverse market conditions shaped by localized factors and broader economic trends.


