
Member Features
Find Real Estate Bargain!
Full foreclosure details
Home value, equity and ownership info
Find homes priced below market
Get full access with a FREE Account
Already a member?
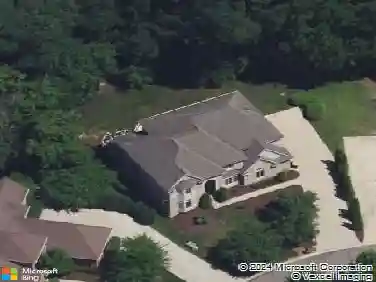
$426,350
Est. Value4beds
3baths
2,530sqft
31,537sqft lot
38289 Southfarm Ln, Northville, MI 48167
Member Features
Find Real Estate Bargain!
Full foreclosure details
Home value, equity and ownership info
Find homes priced below market
Get full access with a FREE Account
Already a member?
Off Market
Home type
Price / sqft
Year built
Home Details
Interior Details
2530
4
3
Has Heating:
Yes
Heating Type:
Forced Air
Has Cooling:
Yes
Cooling Type:
N/A
Has Fuel:
Yes
Fuel Type:
Gas
Has Basement:
No
Basement Type:
Finished
Has Flooring:
No
Flooring Type:
N/A
Has Fireplace:
Yes
Fireplace Type:
Yes
Property Details
31537
No
No
Type:
N/A
Location:
N/A
Status:
N/A
Number of Spaces:
N/A
No
No
No
No
Yes
No
No
Construction Details
Colonial
Aluminum/vinyl
Mat/raft Foundation (slab)
N/A
N/A
Tax History
Year
Amount
Land
Improvement
Percent Change
Assessment
2019
$6,204
$0
$0
--%
$141,940
2019
$6,204
$0
$0
--%
$141,940
2018
$5,600
$0
$0
--%
$129,100
2017
$5,517
$0
$0
--%
$128,100
2016
$5,525
$0
$0
--%
$120,800
2014
$3,671
$0
$0
--%
$88,720
2013
$3,684
$0
$0
--%
$82,470
2012
$3,845
$0
$0
--%
$85,450
Average Home Price in 48167
Nearby Properties
Zip Code
Price
Bed
Bath
Sqft
Lot
Sold Date
$427,880
4 Beds
3 Baths
2,450 Sqft
28,967 Lot (sqft)
Sold 02/13/2024
$411,124
4 Beds
3 Baths
2,612 Sqft
17,598 Lot (sqft)
Sold 12/18/2023
$484,463
4 Beds
3 Baths
2,575 Sqft
26,659 Lot (sqft)
Sold 12/07/2023
$402,115
4 Beds
3 Baths
2,353 Sqft
21,693 Lot (sqft)
Sold 11/10/2023
$564,000
$564,000
3 Beds
2.5 Baths
2,209 Sqft
20,038 Lot (sqft)
Sold 03/17/2024
Calculators
Mortgage
Mortgage Calculator
Details for 38289 SOUTHFARM LN

Property Debt

Foreclosure Contact Details

Current Owner
Transaction History
Similar Homes Nearby

Guides for Southfarm Ln

The 2023 Detroit real estate market trend showed steady average listing values and an increase in property sales, with neighboring cities displaying more fluctuation but higher property values. This reflects the city’s resilience amidst an unpredictable industry landscape.


