
Member Features
Find Real Estate Bargain!
Full foreclosure details
Home value, equity and ownership info
Find homes priced below market
Get full access with a FREE Account
Already a member?
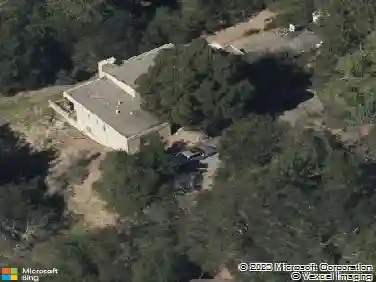
$1,698,000
Est. Value3beds
3baths
1,931sqft
23,522sqft lot
43 Crestview Dr, Orinda, CA 94563
Member Features
Find Real Estate Bargain!
Full foreclosure details
Home value, equity and ownership info
Find homes priced below market
Get full access with a FREE Account
Already a member?
Off Market
Home type
Price / sqft
Year built
Home Details
Interior Details
1931
3
3
Has Heating:
No
Heating Type:
None
Has Cooling:
Yes
Cooling Type:
Central
Has Fuel:
No
Fuel Type:
N/A
Has Basement:
No
Basement Type:
No Basement
Has Flooring:
No
Flooring Type:
N/A
Has Fireplace:
No
Fireplace Type:
N/A
Property Details
23522
No
No
Type:
N/A
Location:
N/A
Status:
N/A
Number of Spaces:
N/A
N/A
N/A
N/A
N/A
N/A
N/A
N/A
Construction Details
N/A
N/A
N/A
N/A
N/A
Tax History
Year
Amount
Land
Improvement
Percent Change
Assessment
2020
$16,926
$1,054,986
$265,914
--%
$1,320,900
2019
$16,900
$1,034,300
$260,700
--%
$1,295,000
2018
$2,967
$50,609
$79,032
--%
$129,641
2017
$2,864
$49,617
$77,483
--%
$127,100
2016
$2,792
$48,645
$75,964
--%
$124,609
2014
$2,705
$46,977
$73,358
--%
$120,335
2013
$2,643
$46,765
$73,027
--%
$119,792
2012
$2,524
$45,849
$71,596
--%
$117,445
Average Home Price in 94563
Nearby Properties
Zip Code
Price
Bed
Bath
Sqft
Lot
Sold Date
$1,482,250
$1,482,250
2 Beds
2 Baths
1,671 Sqft
19,920 Lot (sqft)
Sold 03/21/2024
$1,130,000
$1,130,000
3 Beds
3 Baths
2,108 Sqft
49,658 Lot (sqft)
Sold 01/23/2024
$1,662,705
$1,662,705
3 Beds
2 Baths
1,877 Sqft
13,860 Lot (sqft)
Sold 11/08/2023
$1,995,000
$1,995,000
4 Beds
2 Baths
2,007 Sqft
27,007 Lot (sqft)
Sold 02/21/2024
Calculators
Mortgage
Mortgage Calculator
Details for 43 CRESTVIEW DR

Property Debt

Foreclosure Contact Details

Current Owner
Transaction History
Similar Homes Nearby


Guides for Crestview Dr

This blog post discusses the dynamic real estate trends in Bakersfield, noting fluctuations in property values, sale prices, and activity levels. It also highlights differences in nearby cities, showcasing diverse market conditions shaped by localized factors and broader economic trends.


